Bitcoin Surges 10%—Is the 8-Month Bear Market Finally Over?

Wake up, crypto winter might be thawing. Bitcoin just ripped past resistance with its biggest single-day gain in months—but is this rally built to last?
The 10% pump comes after 240 days of sideways agony. Traders are split: breakout or bull trap? Meanwhile, Wall Street's still trying to short ETFs with both hands.
Key levels to watch: If BTC holds above $XX,XXX (you know the number), the FOMO floodgates open. Fail here? Grab the popcorn for another round of 'macro headwinds' excuses from hedge fund managers.
One thing's certain—when Bitcoin moves, it doesn't ask permission. Whether you're stacking sats or shorting, buckle up.

- Bitcoin breaks past its all-time high by 10%, but analysts remain cautious amid weak follow-through and mixed signals.
- Crypto experts warn that continued altcoin strength could limit Bitcoin’s upside and divert investor capital.
- Technicals remain uncertain as RSI dips below neutral and MACD fails to confirm bullish momentum despite rising volume.
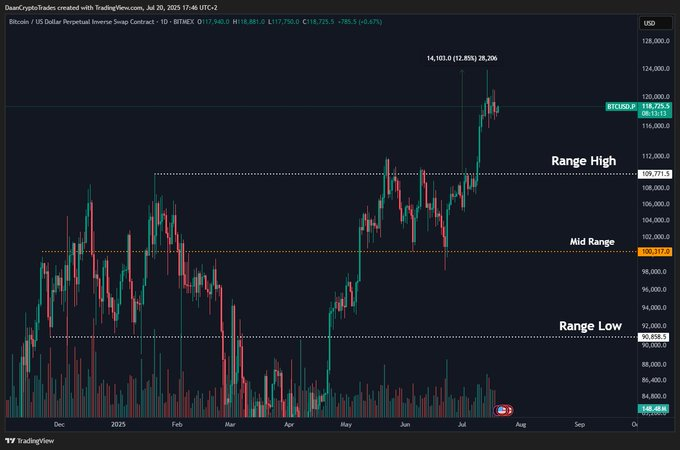
Bitcoin is gaining power again after months of low dynamics. After almost eight months of correction and stabilization, the cryptocurrency has been able to surpass its historic high by over 10%. Although this is considered a positive indicator, analysts warn that this breakout is not as large as preceding breakout cycles, which tended to yield returns of 40-50%.
According to Daan Crypto Trades, this could be a possible breakout as long Bitcoin does not drop below its previous high. He feels that the existing alignment is a sign of strength, but he is apprehensive of downward drifting back into the strata. In that case, it may disrupt the bullish sentiment and postpone the anticipated uptrend all of the year 2025.
Source: X
The activity of altcoins is another aspect that dampens the optimism. In the past, the high performance of altcoins has removed capital out of Bitcoin, blunting its pace. Daan indicated that cycles tend to scale once altcoins have significantly outperformed and, thereby, suggested that incessant investment into smaller assets could shrink the upside potential of bitcoin on a timely basis.
Data Hints at a Cautious Comeback
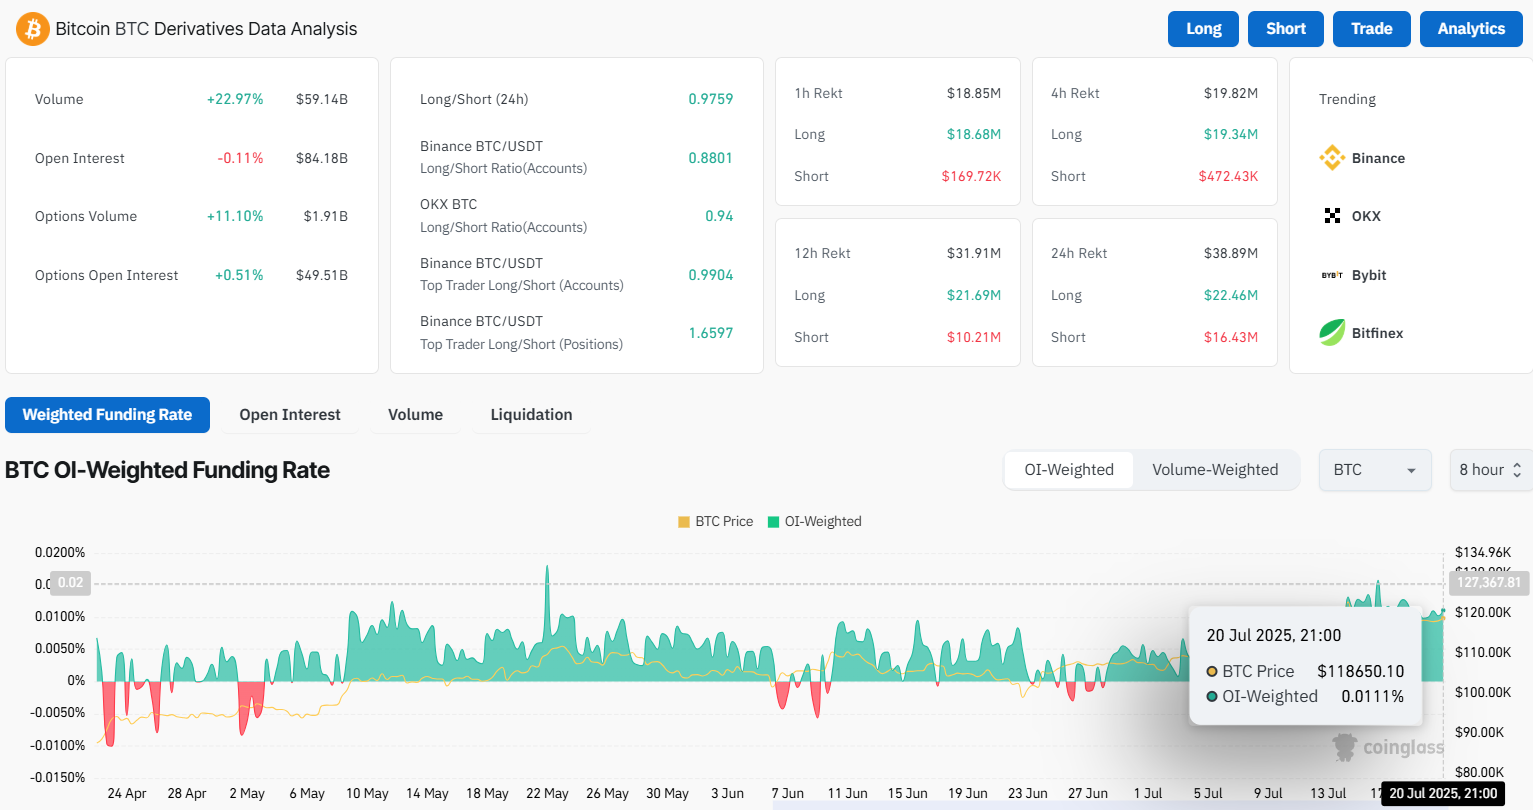
The data provided by Coinglass can bring additional context to the present situation. The volume of trading is up by 22.97%, totaling $59.14 billion, which means that the market is becoming active. Nonetheless, open interest went down a bit by 0.11% to $84.18 billion to demonstrate a restrained attitude of traders that are not eager to open up new positions.
Source: Coinglass
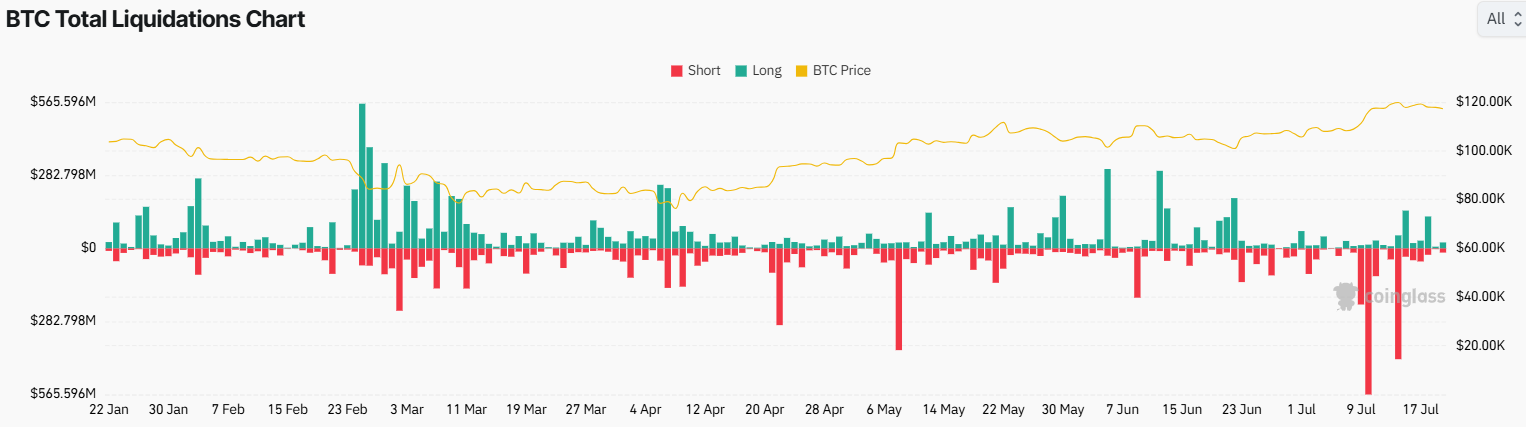
The market sentiment is neutral with an open interest weighted funding rate of 0.0111%. The liquidation activity during the last 24 hours was equal to $38.89 million, of which the long positions consist of $22.46 million, and short positions total $16.34 million. These numbers indicate a fairly healthy market, with no directional bias taking over the current situation.
Source: Coinglass
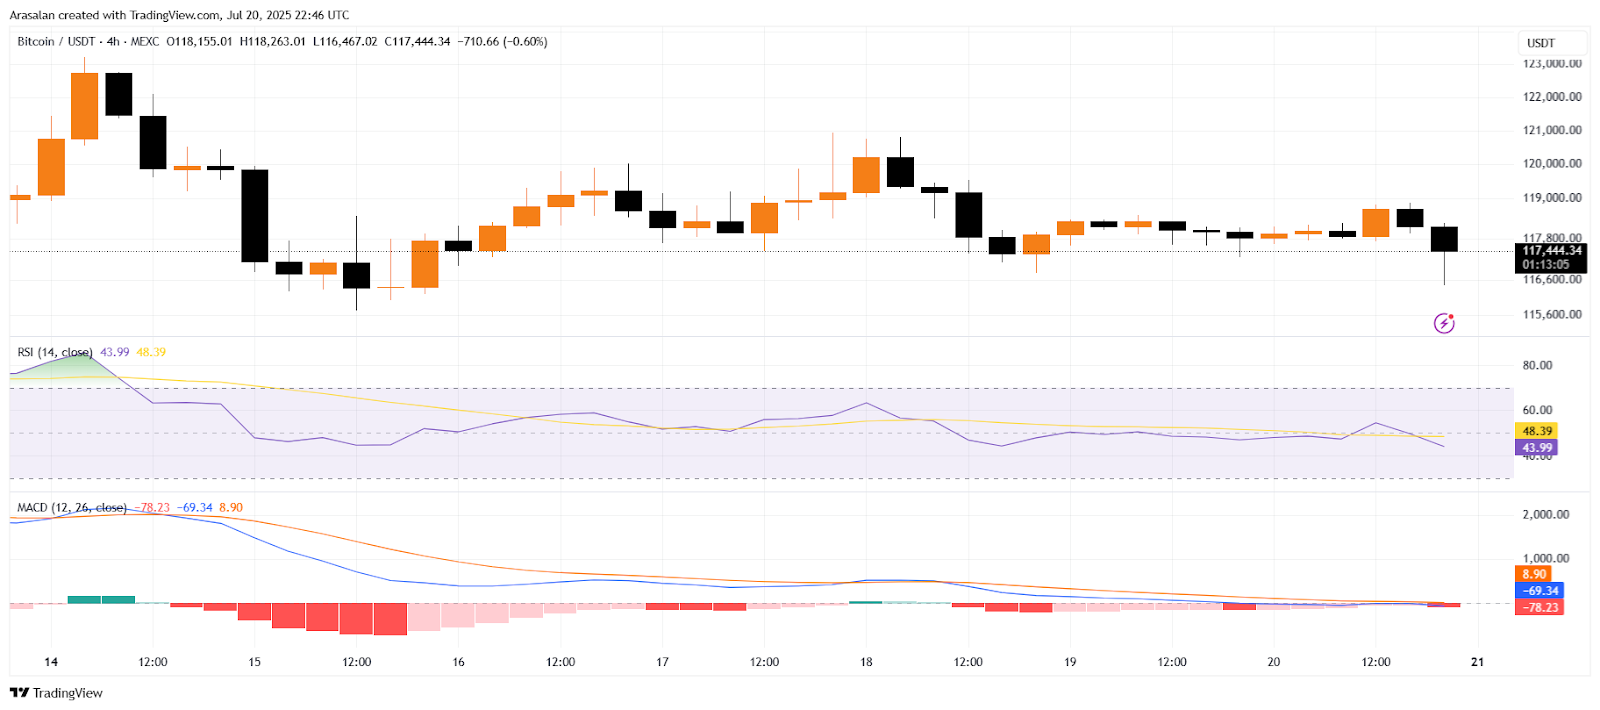
Technical indicators are taking a mixed view too. The last 4-hour candle happened to be closed at $117,444 and decreased by 0.60%, and the price still represents a trend of lower highs and higher lows. The bearish formation is an indicator that sellers are still in control of the market and the buyers are not firmly in control of the momentum.
The Relative Strength Index (RSI), in fact, now stands at 43.99, which is below the 50 index of neutrality. The indication of this level is that the bearish momentum is at work, though the asset is not oversold yet. The RSI also depicts a minor downturn, which further supports the notion that the bullish momentum is not gaining pace and instead things are falling.
Bitcoin Struggles Below Key Resistance
In the meantime, the MACD indicator is set at a negative level. The MACD line is currently at -69.34 with the signal line resting at -78.23. Even though the histogram is tightening, there is no evident indication of a bullish crossover. This just adds to the fact that the current buying power does not warrant the power to make a continuous head rush.
Source: TradingView
The previous failure of Bitcoin to MOVE through the resistance level of $119,000 reveals other small-bodied candles that show that the market is stalled. A bearish candle that reveals a lower wick means that there is renewed selling activity. The nearest support lies around $116,400 and $116,600, and the resistance is between $118,200 and $118,600.
At this point, the future of Bitcoin is still uncertain. It is most likely to be the next major step, whether it will be possible to stay above the key support and regain the more appreciable levels of resistance. Until that point, traders are being cautious on the market where capital is still switching to altcoins, and there is a mixed technical picture.
