XRP Rockets to Multi-Month Highs: Is a $4 Breakout Imminent?

XRP just blasted past resistance levels—traders are scrambling as the token hits highs not seen in months. Could this be the start of a parabolic rally?
The Pump No One Saw Coming
After months of sideways action, XRP suddenly woke up with a vengeance. The charts don’t lie: double-digit percentage gains in days, leaving skeptics eating dust.
$4 or Bust?
With momentum like this, the $4 price target—once dismissed as hopium—is back on the table. Analysts whisper about FOMO kicking in, while institutional traders quietly adjust their positions (better late than never, right?).
A Reality Check for the Bulls
Sure, the surge is impressive—but let’s not forget this is crypto. Today’s moonshot could be tomorrow’s ‘rug pull’ if liquidity suddenly dries up. After all, Wall Street’s ‘smart money’ still thinks digital assets are a casino. Maybe they’re just jealous.

- XRP surges over 25%, smashing through key resistance to hit fresh highs.
- Strong indicators back the rally, but overbought signals suggest a possible cooldown.
- A retest around $3.12 could act as a base for the next major move.
Rallying with a steep move, XRP is currently at $3.42 following a 25.35% increase in the last seven days. On the day, the token reached a peak at $3.4865, rising above previous resistance zones, including $2.80 and $3.24. The price is now closing in on the R5 level at $3.5481, with intensity not witnessed in several months.

This breakout is the culmination of several days of close consolidation and indicates a new wave of buying interest. Buyers are firmly in control, and the breakout above multiple tiered resistance levels is an indication that confidence is building. The breakout has placed the $3.75–$4.00 area in focus as the next significant price level of interest.
Indicators Flash Strength and a Hint of Caution for XRP
Momentum is solidly bullish; however, there is some evidence that the market is in need of a correction. The Relative Strength Index is at 83.78, well into overbought levels. While this doesn’t predict that a reversal is due, it is a signal that the speed might slowly taper off. A correction or sideward extension WOULD do well to cool off the sizzling conditions.
Checking the MACD, it presents a different narrative. The MACD line is at 0.29776, considerably higher than the signal line at 0.19645. The histogram is still increasing, indicating strong bullish pressure with no indications of weakness so far. It’s a clean affirmation that the trend is still up.

Price action is also well above the 9-day EMA, 20-day SMA, and 50-day SMA. All these are sloping upwards and further support the strength in the rally. The 200-day SMA is much lower at the levels we are looking at, which shows how much XRP has rallied above longer-term averages.
Support levels to watch for help in case the market corrects are $3.24, the earlier R3, $2.88, and $2.49. They could act as buffers in case the market corrects.
Watching the $3.12 Fib Level for Retest Possibility
EGRAG crypto highlighted $3.40 as an important Fib level. Staying above it keeps the bullish structure intact. But he did mention the chance for the pullback down to $3.12, the Fib 0.888 level, and this could be the spot for a good, healthy retest before the next massive move.
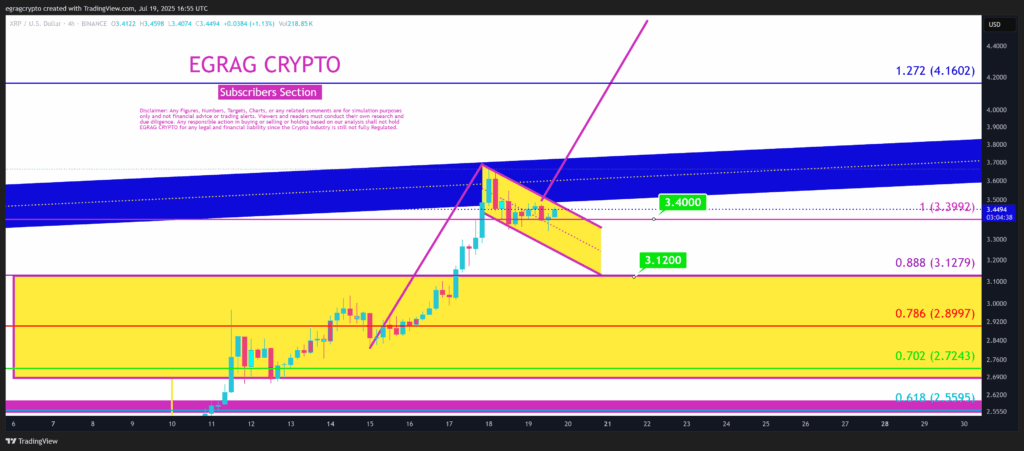
If XRP were to retest $3.12 and hold the zone, this could be the start of the next leg higher. If the price, though, skips the retest and goes further higher, this suggests bulls are well in charge and pushing harder than expected.
So far, XRP remains in a solid uptrend. As long as it stays above the $3.24–$2.88 range, traders will likely remain confident. The next possible targets now sit at $3.75 and even $4.00 in the NEAR future.
