Aptos (APT) Primed for Breakout: $8–$9 Target in Sight as Bulls Take Control

Aptos (APT) isn't just climbing—it's gearing up for a full-throttle rally. Here's why traders are flipping bullish.
Targets locked: The $8–$9 zone isn't a hope—it's the next liquidity magnet. APT's price action suggests the market's finally shaking off its 'wait-and-see' paralysis.
Volume tells the story: Quiet accumulation? Check. Breakout confirmation? Pending. Unlike legacy finance's spreadsheet jockeys, crypto traders actually respect momentum.
Warning: This isn't financial advice—just a reminder that in crypto, the 'smart money' is often the money that moves first.

- APT price rises 7.71% over the week despite a 24-hour dip.
- Price nears critical breakout from descending resistance trendline.
- The short-term target is set at $8–$9 if the breakout is confirmed.
Aptos (APT) is trading at $5.26, registering a 3.41% decline over the last 24 hours. This is a temporary loss, however, and the altcoin remains firmly in the black for the last seven-day period, rising 7.71%.
With the help of a 24-hour trading volume coming in at $339.23 million and a market capitalization of $3.44 billion, the cryptocurrency is sending good signals for further upward movement.
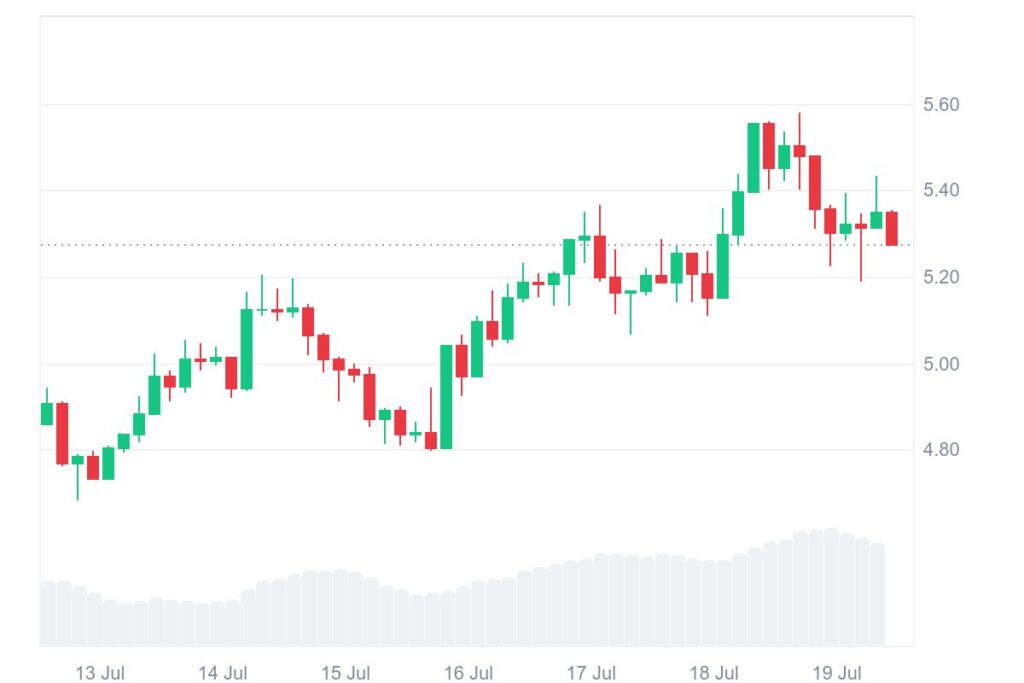
The recent 7-day candlestick pattern shows a clear uptrend, which was originally noted after a sideways movement. APT broke the significant $5.00 level with strong buying and then corrected marginally after selling profits.
Regardless, the bulls regained control and pushed the price above $5.60, though the recent candles providing lengthy wicks indicate growing indecision in the market.
Currently, the token is trading between the $5.20 support and $5.45 resistance, with decreasing volume indicating a breakout is due.
APT Price Analysis Hints at Breakout Ahead Soon
Technical indications by crypto analyst CryptoBullet have fuelled bull optimism. Through a thread uploaded on X, the key resistance level to watch has been identified as a downtrending trendline that dates back as far as January 2024.
APT is in the process of testing the trendline at the $5.40 region, and the analyst’s chart includes a bullish target annotated with a blue arrow at the $8-$9 short-term price region.
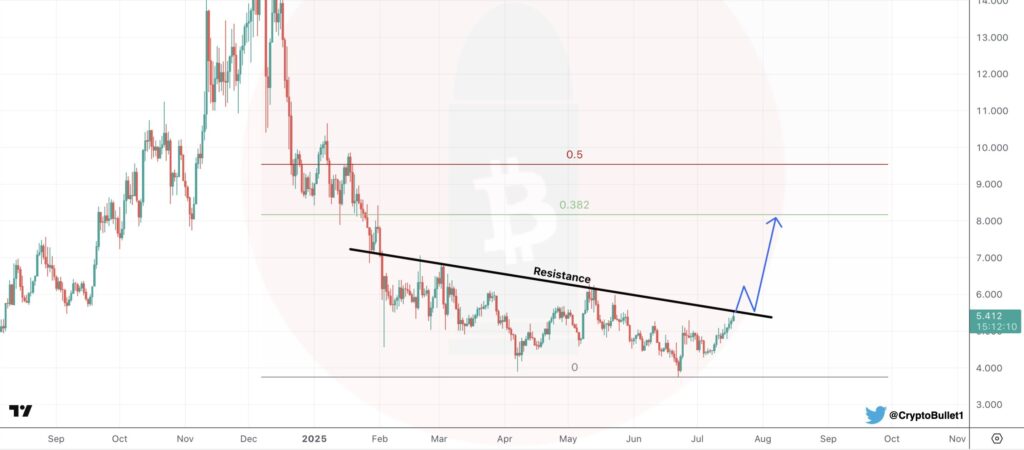
This downtrend line previously rejected bullish rallies, so this recent test is a potential pivot. A bullish case is also made by the formation of a rounded bottom pattern just below resistance, more typically indicative of an endogenous reversal formation.
A confirmed breakout could take APT through the 0.382 Fibonacci retracement price at $8.00. A more bullish MOVE could reach the 0.5 Fib level at $9.80, while a longer-term bullish scenario could reverse the price back toward the $16.00 level, depending on the bigger market sentiment.
Will APT Break Through or Retrace?
Despite the growing bullishness, the market remains nervous. Fading volume suggests the trading community is seeking confirmation before making strong directional calls.
A breakdown below the $5.45 resistance could catalyze another pullback, revisiting the support around $5.00 or lower points at $4.00-$4.50.
Days ahead will be important. If the token manages to breach its centuries-old resistance with strong volume authentication, it could create avenues for a fresh uptrend in Q3 2025. In the meantime, eyes remain firmly planted in the $5.40–$5.45 region, APT’s primary breakout zone.
