Solana (SOL) Surges Past Resistance—$180 Target in Sight as Bulls Charge

Solana isn’t just breaking out—it’s bulldozing through resistance like a meme coin with a VC backer. The $180 price target? Suddenly looking like a pit stop.
Why the rally? Blame the usual suspects: ETF whispers, network upgrades, and traders chasing the next big thing after getting rekt on last month’s shitcoin du jour.
Technicals scream bullish. The chart’s forming a textbook ascending triangle—if you’re into that sort of astrology. Meanwhile, perpetual swaps show longs piling in faster than a degenerate at a roulette table.
Word to the wise: Watch the funding rates. Nothing funnier than watching leverage junkies get liquidated because they forgot crypto moves both ways. Classic.

- Solana breaks above key VWAP and Fibonacci resistance, targeting the $180 level.
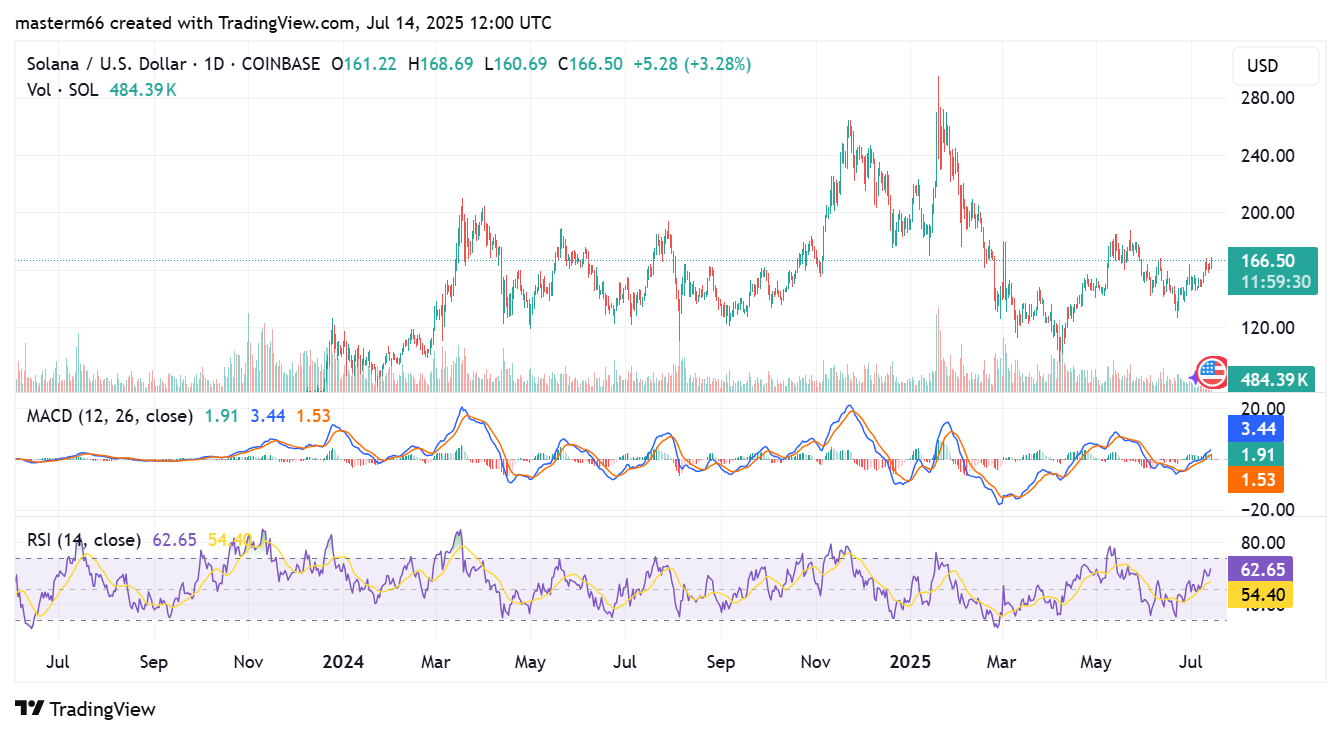
- Bullish momentum confirmed by MACD crossover and strong EMA support alignment.
- RSI and Stochastic RSI suggest overbought, but the trend remains intact and strong.
According to the TradingView chart, solana (SOL) is exhibiting an upsurge in trend. It has currently risen to $166.93, increasing by more than 3.5% within the past 24 hours. This takes the token to higher technical levels and confirms its rising demand. As the indicators are improving and there is a lot of momentum, SOL could make further price gains.
Solana Breaks out of VWAP and Fibonacci Resistance
This break comes after the price crossed the Volume Weighted Average Price (VWAP) of $165.44. So long as it remains above this level, it means that buyers are in control. It has also seen volume increasing to 485K, which indicates that the market is reacting to this breakout. SOL is at a very crucial point at the moment in terms of price structure, and a clear close above its current price might open up the path towards $180.
Considering the Fibonacci retracement levels, Solana has reclaimed the 0.786 level above $164.13 and is on its way to the 0.618 level at $172.49. The level is normally a big resistance or bounce area. Once it breaks through the $172 level, the next resistance price level would be the range of $180.
There are Exponential Moving Averages (EMAs) as well, which confirm the bullish set-up. SOL has broken out above its 20-day EMA ($153.09), 50-day EMA ($152.84), and 200-day EMA ($164.01).
Source: TradingView
SOL Remains Bullish Above the Averages
This price action has resulted in the switch of these moving averages into support, indicating trend coherence. It is also far above the 9-day EMA at $158.42. A similarity in short- and long-term averages is normally an indication of strength.
The Stochastic RSI on the daily chart is in overbought areas, and the %K stands at 81.89 while the %D stands at 82.34. Although this is considered a temporary exhaustion, it might not reverse in case of continued momentum. During heavy bull trends, the overbought signs may linger even several days.
The MACD has recently displayed a bullish crossover. The MACD line stands at 1.91, higher than the signal line, which stands at 1.53. This means that bullish momentum is increasing. The direction of the trend is positive, although the histogram is not high yet.
RSI has gained comfortable ground and is currently at 62.65. Such reading represents gaining momentum, yet it’s a sign of caution as it is close to the resistance areas. Hence, the RSI has room for further gains before reaching the extreme levels, which is bullish near-term.
Paying Attention to the Important Resistance Area at $180
Technically, SOL has established a sequence of increasing lows ever since it hit a bottom at $126. This is a confirmation that the bearish trend earlier in the year has been reversed. The second major resistance level is the $180-$185 zone, as it was a rejection zone in the past.
A break and hold above that level confirms this wider trend continuation. On the negative side, the support is around the level of $153, which coincides with 50-day EMA and the 0.5 fib on the downside.
: This article is based on real-time market data and general technical observations. It does not constitute financial advice. Always conduct your own research before making investment decisions.
