SUI Nears Make-or-Break $4.50 Resistance—Next Stop $6 as Bulls Charge Forward

SUI's price action is flirting with a critical breakout moment—and traders are betting big on a moonshot.
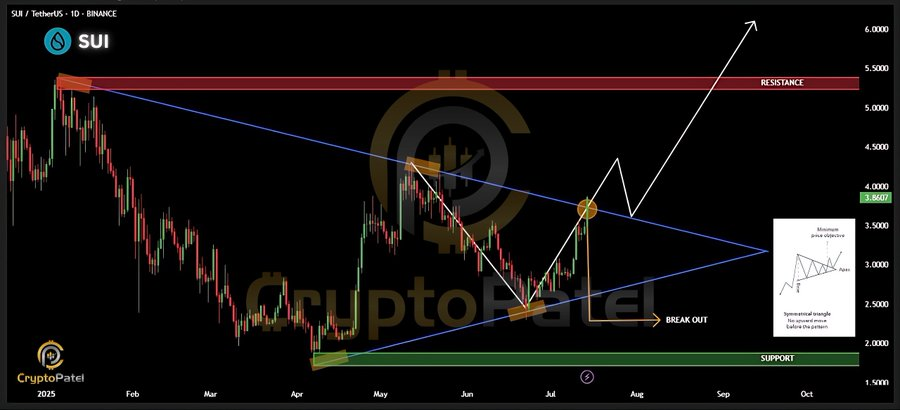
The $4.50 resistance level has become crypto's latest high-stakes poker game. Break past it, and the path clears for a sprint toward $6. Stall here, and well… enjoy the sideways grind.
Market momentum suggests the bulls aren’t done yet. Liquidity pools are stacking up like Wall Street bonuses—thick, fast, and slightly suspicious.
One thing’s certain: In a market where ‘fundamentals’ often mean ‘which influencer posted a moon emoji,’ SUI’s next move will be pure theater.

- SUI is trading at $3.95 after a 15.11% daily jump and a 35.96% weekly surge, signalling bullish momentum.
- A breakout above $4.50 could lead SUI to $6 or $10, supported by strong chart patterns and rising volume.
- RSI at 72.80 and bullish MACD confirm strong buying pressure, with traders eyeing the next leg upward.
As of press time, sui is trading at $3.95, marking a modest increase of 15.11% over the past day. The trading volume for the same period stands at $13.66 billion, reflecting a 15.09% uptick. Over the last week, the SUI coin price has increased by 35.96%.
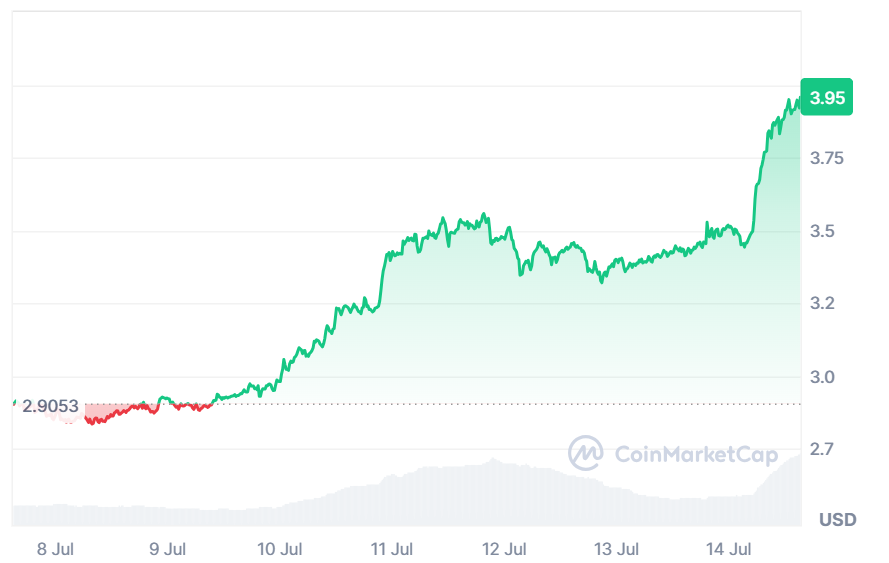
Source: CoinMarketCap
The SUI chart is creating a symmetrical triangle pattern. According to analyst crypto Patel, this is an indication of a major breakout. A breakout in SUI above $4.50 means that a short-term dip to the resistance of $3.50 can be anticipated, followed by an upward push. His targets are $6 and potentially $10, which is due to momentum. The chart indicates a vigorous accumulation in critical resistance areas.
SUI is supported by major players such as VanEck and Lion Group. It has a daily volume of more than $906 million. The company has a market cap of $11.9 billion, indicating a good amount of investor interest. The liquidity is high and promotes future price growth.
Source: X
RSI Indicates Strength
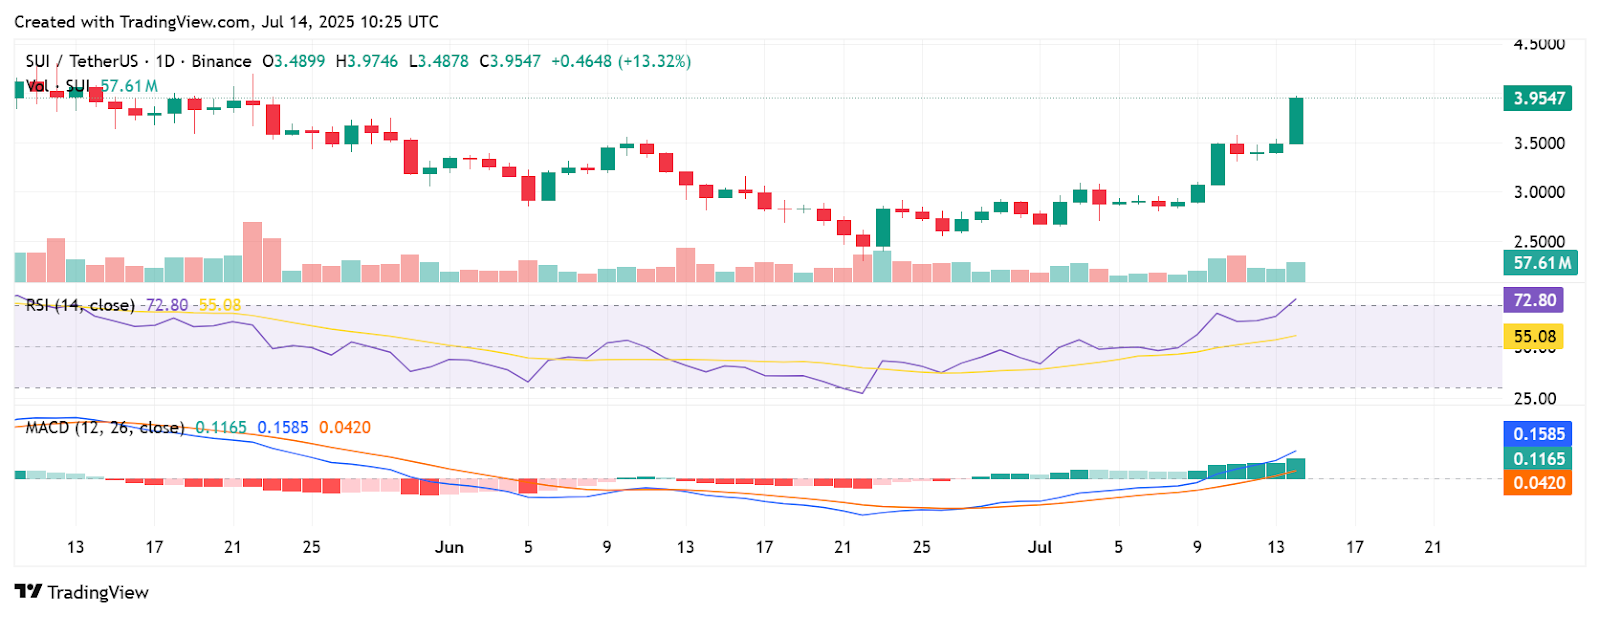
The relative strength index is 72.80, indicating that the asset is overbought. A figure higher than 70 indicates strong buyer demand. The RSI was fast approaching neutral levels of 50. This change indicates an increasingly rapid price action strength.
Source: TradingView
The moving average convergence divergence is bullish. The signal line stands at 0.0420 and the MACD line stands at 0.1585. MACD has crossed over the signal and zero line. Such a configuration affirms bullish strength. The histogram is still growing green.
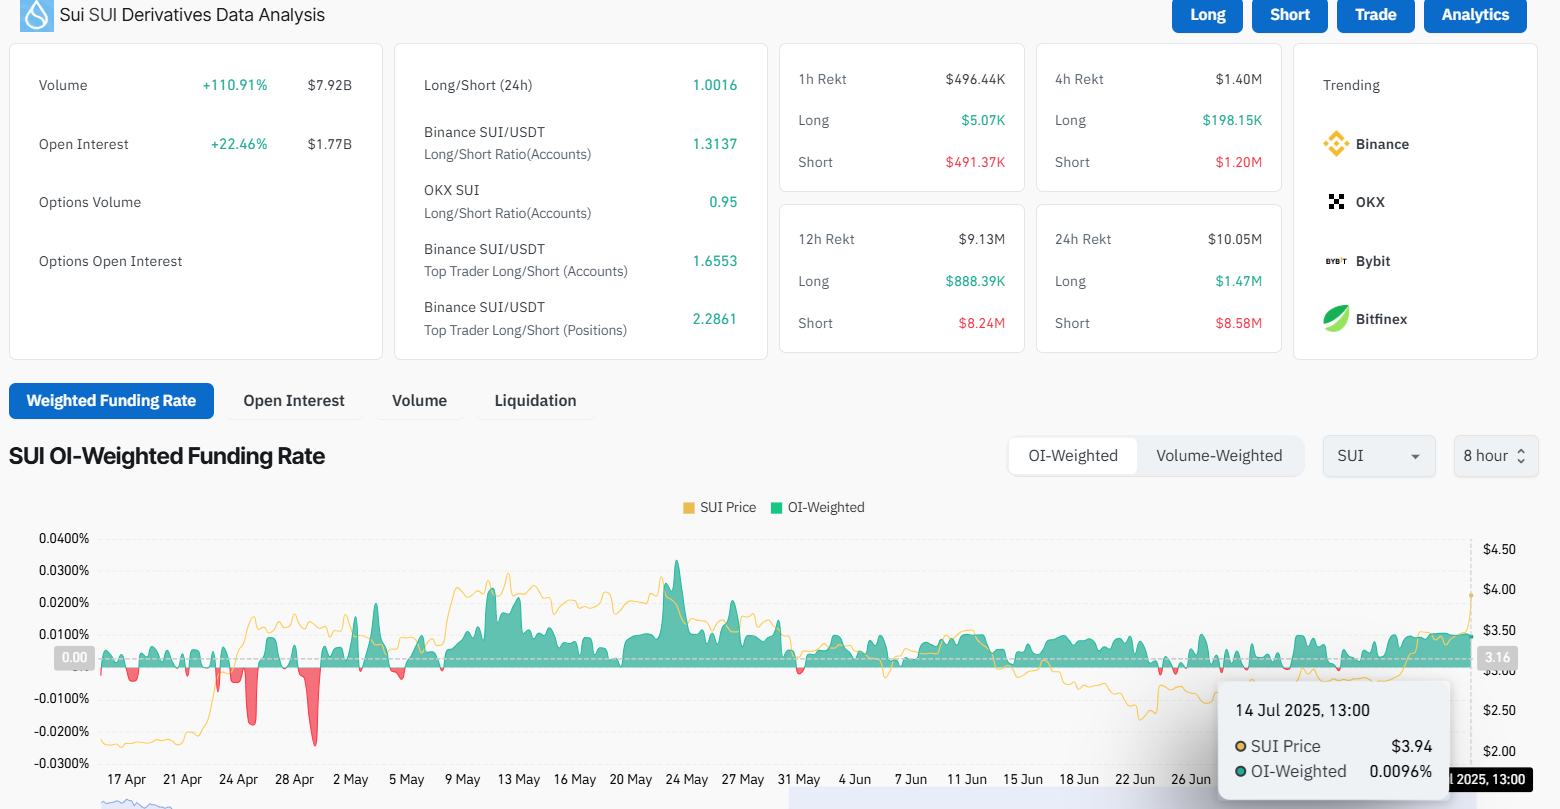
According to CoinGlass data, the volume increased by 110.91% to $7.92 billion. Open interest gained 22.46% to the level of $1.77 billion. These figures show increased trader involvement. The OI-weighted funding rate indicates that the majority of the positions are long with 0.0096%.
Source: CoinGlass
SUI Approaches Key Breakout
Technical analysts note another indication of bullishness. The World of Charts revealed that a symptom of a breakout of a bullish pennant is probable. Repeated rallies have followed a pattern in the project. They are anticipating a 2x rally at the currently given levels in case the trend endures.
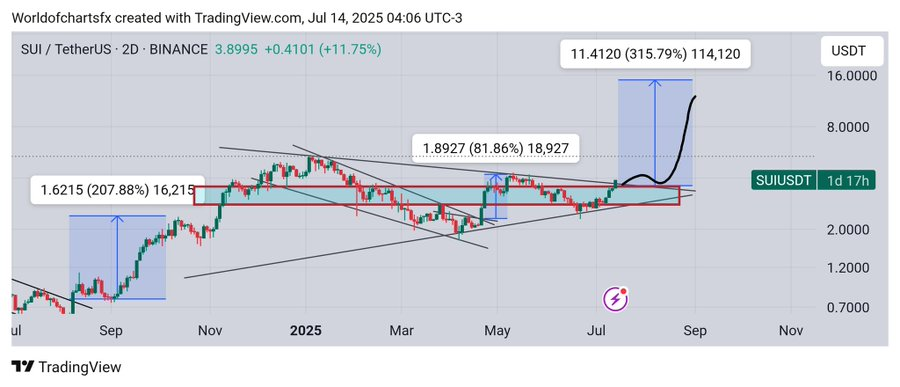
Source: X
SUI has indicated significant returns on a high volume and technical support. Both RSI and MACD give support to further upward movement. The market data reports a high enthusiasm with high inflows. The point to be observed by the traders is the mark of $4.50. The next major leg up could begin with a clean breakout.
There is now technical alignment and increased momentum, SUI may be gearing up to rally towards another sharp move. The current focus is on new targets of over $6 and even $10.
: This article is based on real-time market data and general technical observations. It does not constitute financial advice. Always conduct your own research before making investment decisions.
