🚀 Bitcoin, Ethereum, XRP Price Surge: Is the Crypto Bull Run Just Getting Started?

Crypto markets are roaring back—but is this rally built to last? We break down the forces driving Bitcoin, Ethereum, and XRP to new heights.
The Big Three Flex Their Muscles
BTC smashes through resistance levels like a wrecking ball. ETH’s smart contract dominance shows no signs of slowing. Even XRP—yes, XRP—is catching bids despite regulators’ best efforts.
Institutional FOMO or Retail Frenzy?
Wall Street’s late to the party (again), but their checkbooks are open. Meanwhile, Main Street traders are piling in faster than you can say ‘leveraged long.’
The Skeptic’s Corner
Let’s be real—half these ‘fundamental analyses’ are just moon math wrapped in technical jargon. Since when did ‘number go up’ become an investment thesis?
The bulls are charging. Question is: who’s holding the reins—and who’s just along for the ride?
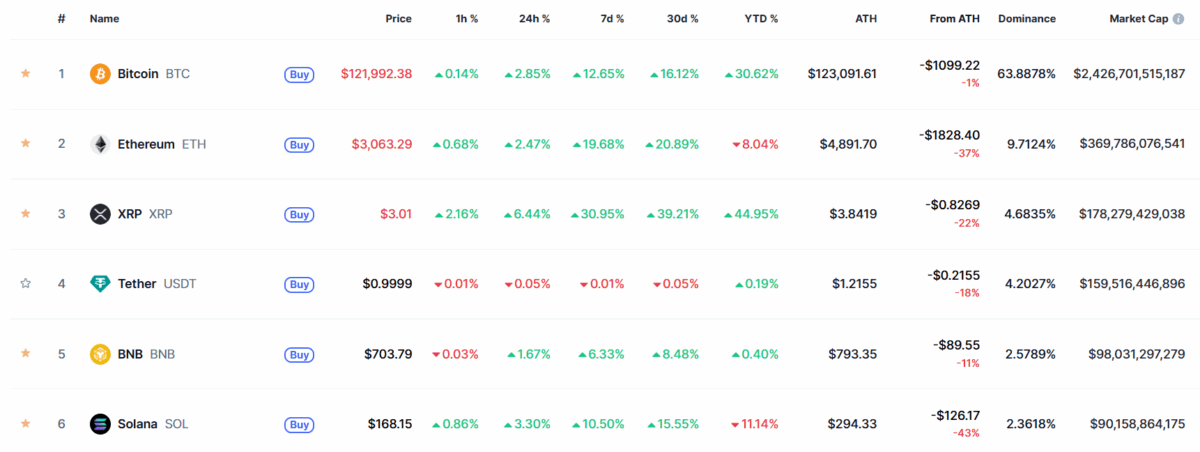 Source: CoinMarketCap
Following in the footsteps of this, the altcoin market has picked up pace with most tokens bursting out of their crucial watch zones and displaying a multi-month high. Considering the present market sentiments and extreme volatility, will BTC, ETH, and XRP prices maintain their bullish angle this week?
BTC Price Hits $123,000 For The First Time Ever
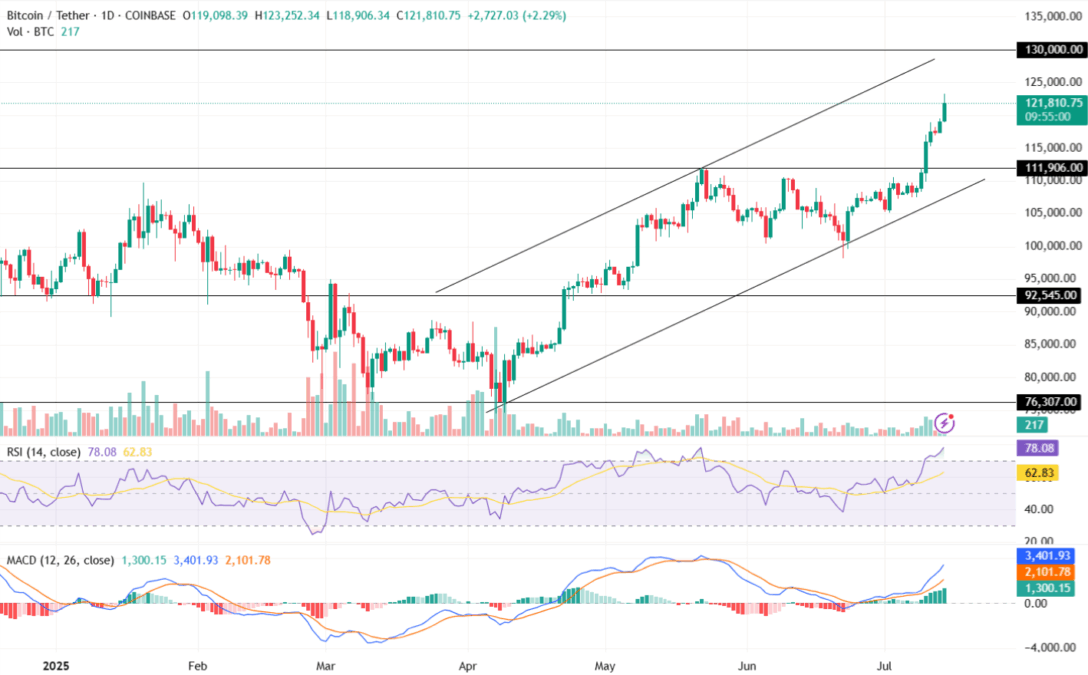
By maintaining its bullish action, Bitcoin price has formed an ascending trend pattern and continues trading within it since April 2025. With a price of $121,810.75 and a trading volume of $174.96 billion at the time of writing, the BTC market cap has crossed the $2.40 trillion. Following this, the dominance of it has stabilized at 63.8976%.
When evaluating the last 23 active BTC ETF trading days, there is a record of only 1 negative day, against 22 positive days. This shows rising interest of investors and traders toward BTC ETF. Additionally, the IBIT ETF owned by BlackRock leads the pack with a valuation of over $84 billion.
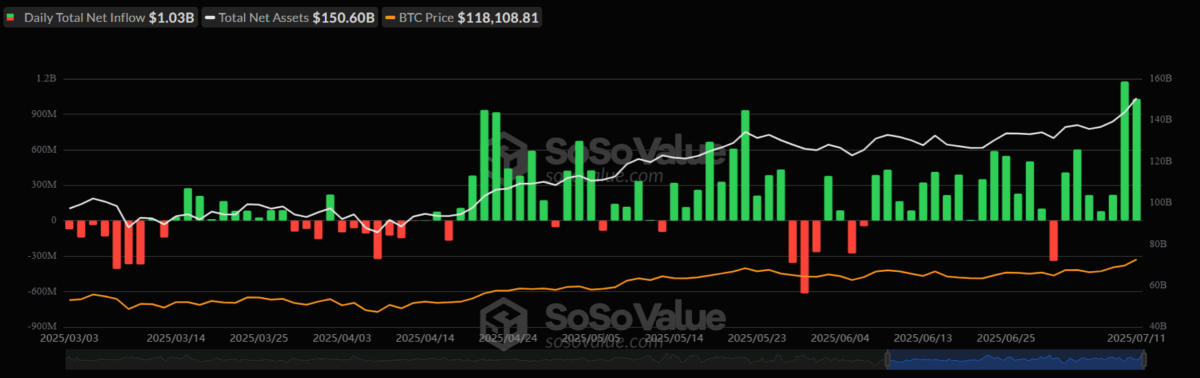
Also, it experiences an inflow of over $1 billion for 2 consecutive days, making the bitcoin ETF inflow streak unbeaten for seven days as per the data from July 11. Let us now look more deeply into Bitcoin sentiments and watch levels.
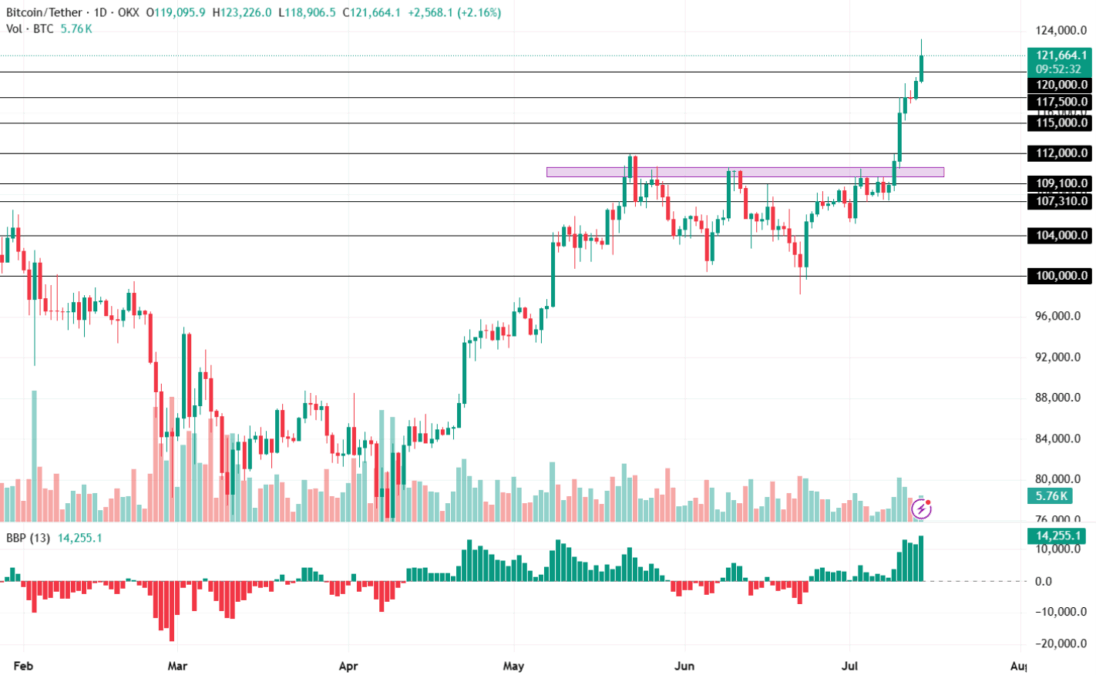
The Bear Bull Power (BBP) shows a major upward trajectory after recording a steady green histogram in the daily frame. This trend change suggests a significant rise in the buying pressure for the BTC price in the market.
Sustained bullish momentum could push the price toward its immediate test of $124,000. Increasing positive influence may result in it heading toward its upper target price of $125,000 this week. In case of increased profit-booking, it may retest its support trend levels of $120,000 or $117,500 respectively.
Ethereum Price Reclaims Its $3,000 Level
Largest altcoin by market cap, the ETH coin price has finally reclaimed the $3k mark for the first time since 02nd February 2025. After breaking out of its triangle pattern, the ethereum price displayed a sideways price action for a few days. As the market volatility increased, it witnessed a massive price surge.
The recent price action has resulted in the ethereum crypto achieving a market share of 9.7124% with a market capitalization of $366.028 billion. This sums up about 26.90% of the altcoin market share, making it a major dominant in the category.
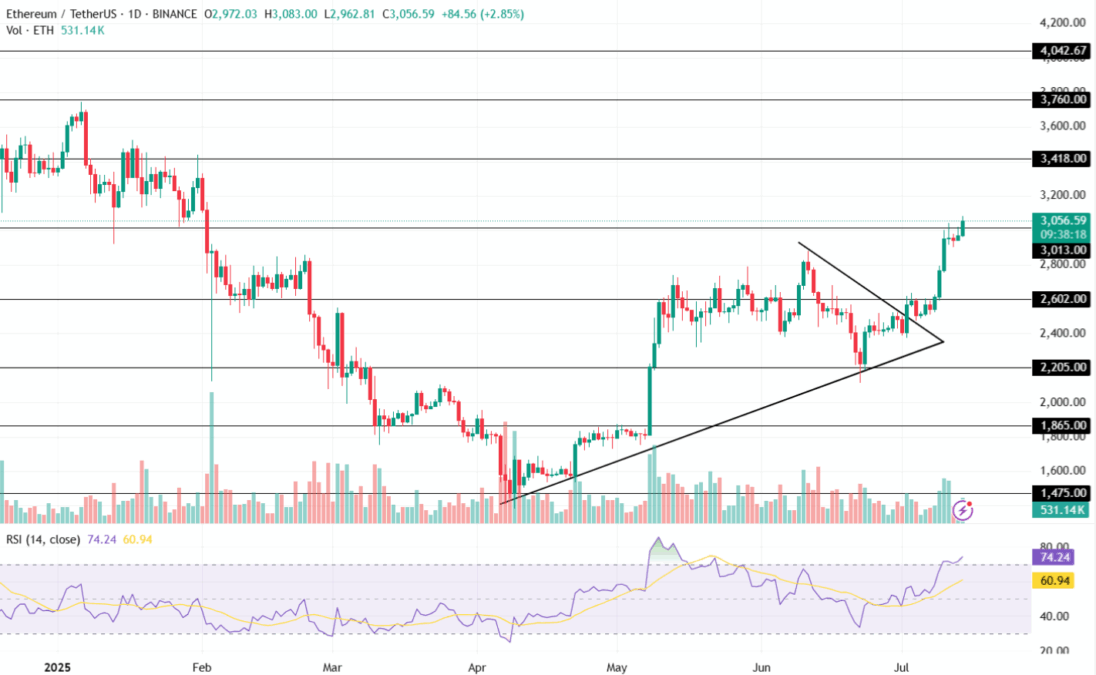
The Relative Strength Index (RSI) has surpassed the overbought (70) range in the daily time frame and is currently at 74.24. This further highlights a potential short-term correction as the altcoin has reached a key price of $3000.
However, the current market shows extreme bullish sentiment, indicating price rally to follow after the retracement cooldown. Considering the market sentiments, the altcoin market may record uncertain price action this week.
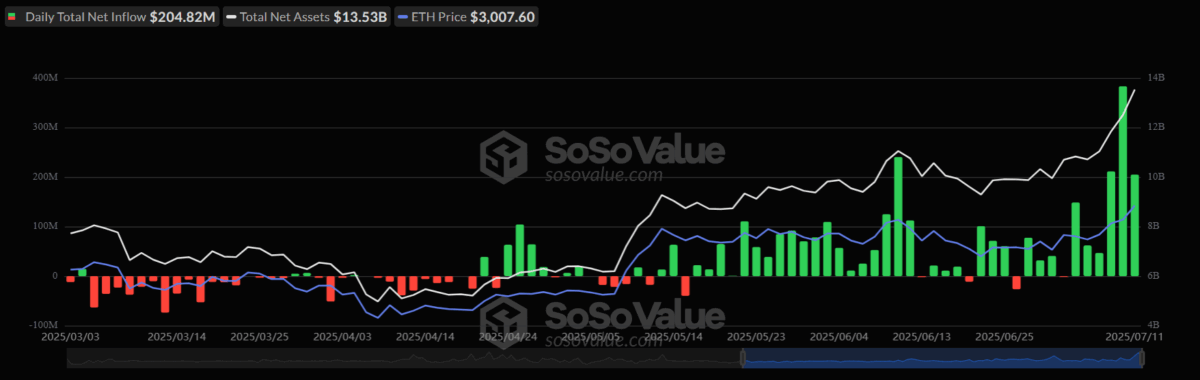
Ether ETFs have registered a similar action as it has shown a negative flow for only 4 days in the last 39 days. As per data, this is by far one of the best tract records of Ethereum ETF since its inception. Falling just shy of $400 million in net daily flow, BlackRock continues dominating the ETF space in the crypto-verse.
Maintaining the value above its $3,013 mark could set the stage for it to head toward its upper price targets of $3,200 or $2,418 respectively. Conversely, a bearish reversal may pull the value toward its immediate support level of $2,800 or $2,602 this week.
XRP Price Successfully Retests $3 Today
The xrp price has gained significant attention over the last 7 trading sessions, resulting in it smashing the $3 mark. With this, the market capitalization of it has increased to $176.14 billion, making it officially the 03rd largest crypto asset in the world. Moreover, its market share has now increased to 4.6835%.
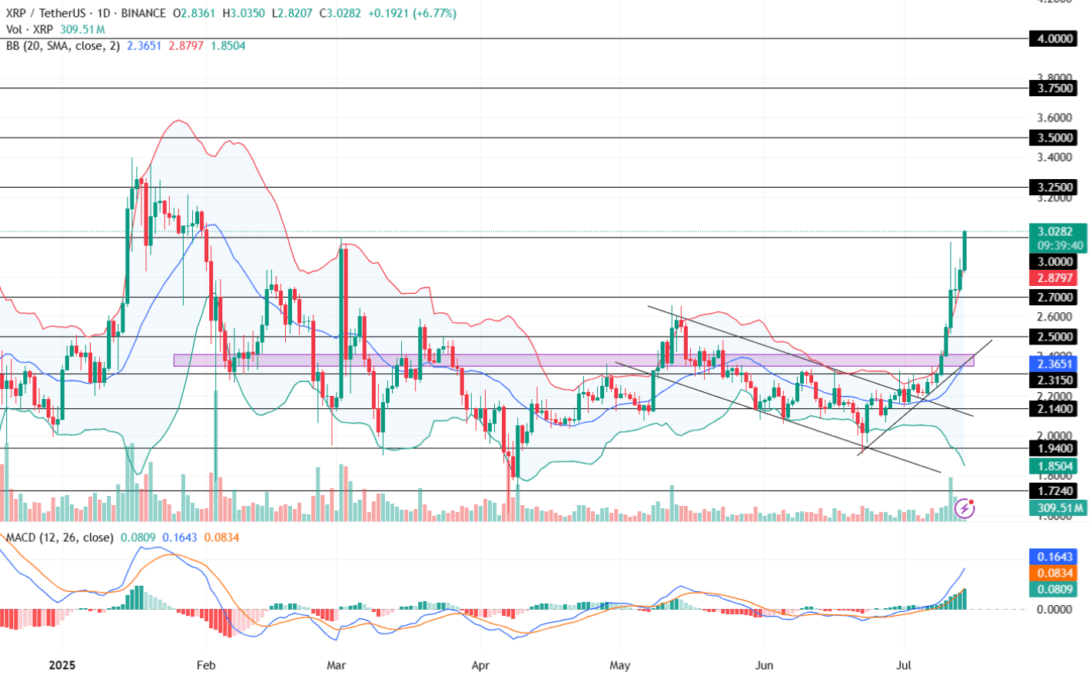
The Bollinger Bands (BB) record a major expansion around its neck. Notably, this kind of trend was last experienced during the month of May when the ETH price recorded a rally of approximately 43% within three trading days. A similar trend is currently being observed, suggesting a rising dominance of bulls in the market.
The Moving Average Convergence Divergence (MACD) on the other hand shows a steady rise in the chart with its averages 12 & 26-day recording an upward price trend. Increasing momentum may lead to XRP crypto retesting its upper price targets.
The key resistance test levels for the XRP price is at $3.25 that was last recorded in January. If the bulls maintain the control of the market at that point, it may lead to it retesting its multi-month high of $3.50. However, lower support levels stand strong at $2.7 and $2.50 in case of a bearish pullback.
Aave Surpasses $50B in Net Deposits. What’s Next for Altcoin?

