Solana’s Bull Run: Will It Smash Through $160? Critical Resistance Levels & Market Outlook

Solana rockets toward $160—can it break through or will resistance hold? Here’s what traders need to watch.
Key levels in play as SOL tests market patience. The 'Ethereum killer' narrative gets another stress test.
Meanwhile, Wall Street still can’t decide if crypto is dead or the next big thing—classic hedge fund whiplash.

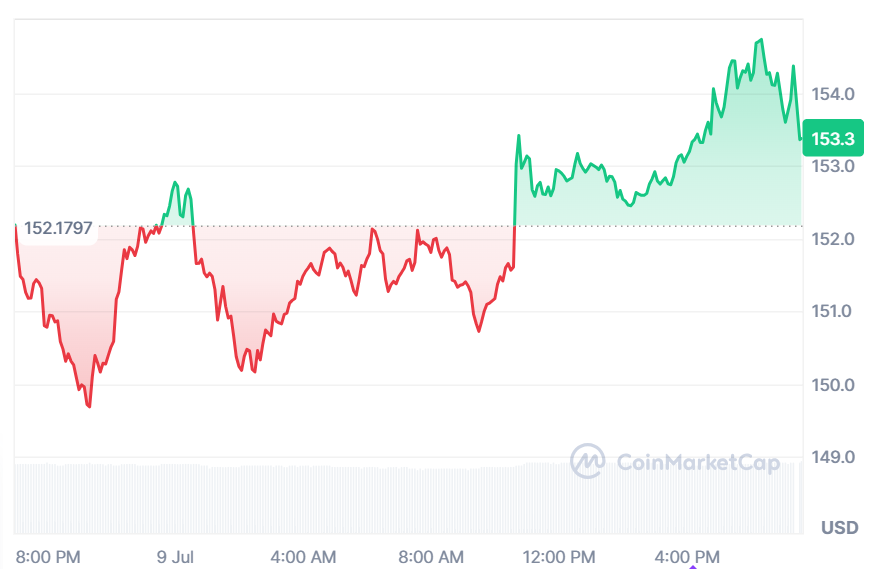
- Solana has seen a 1.34% rise in the last 24 hours, with trading volume reaching $4.18 billion.
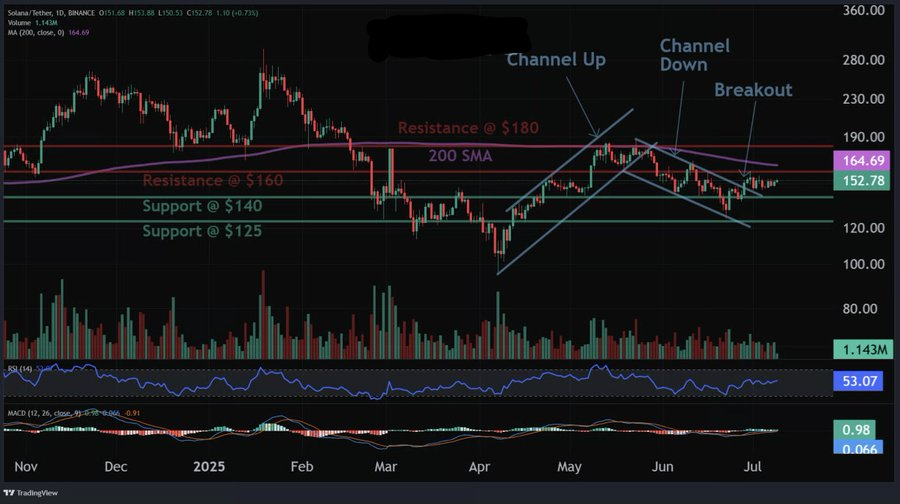
- The recent breakout from the Channel Down pattern suggests a 10% potential gain, targeting $160–$167.
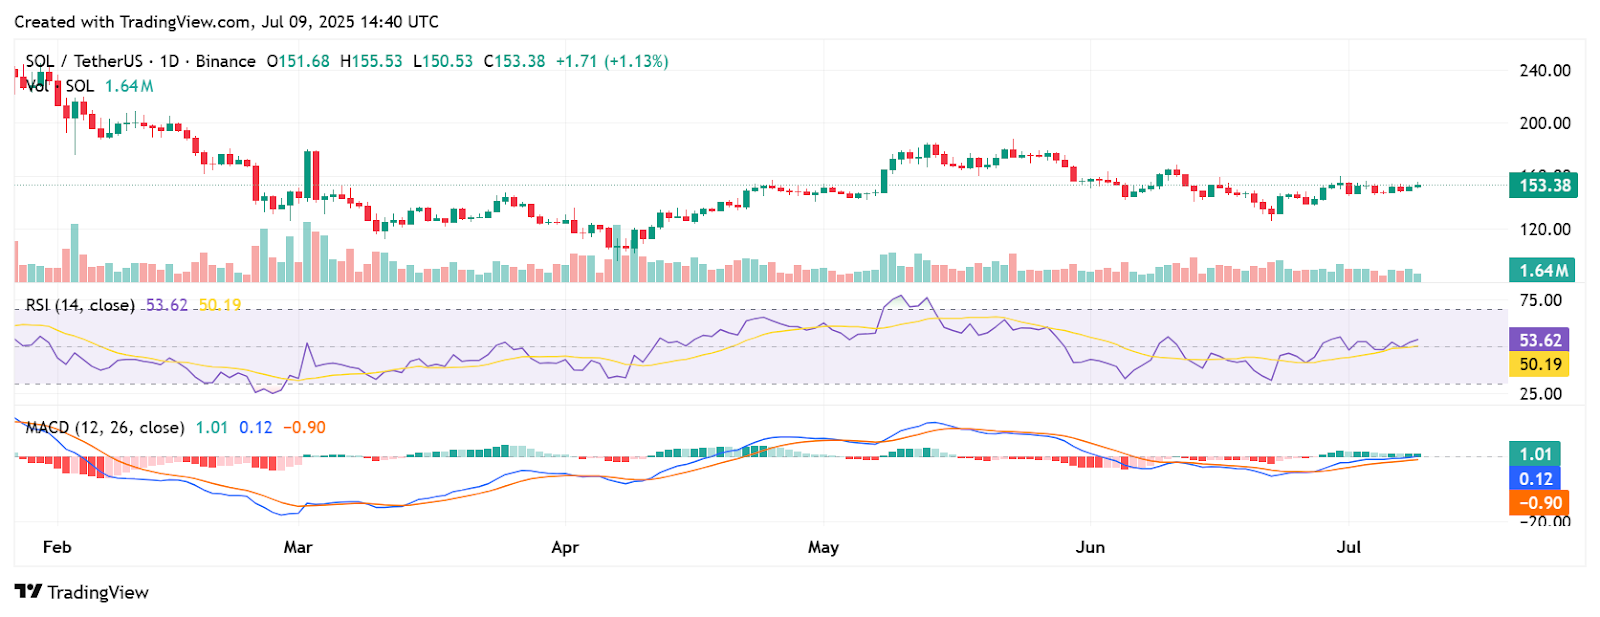
- The RSI is neutral at 53.62, suggesting room for price movement, while the MACD indicates bullish momentum.
AS of press time, solana is trading at $153, reflecting a 1.34% increase over the past 24 hours. The trading volume for the same period stands at $4.18 billion, showing a 2.69% uptick. Over the last 7 days, the Solana coin has increased by 2.4%.
Source: CoinMarketCap
CoinCodeCap trading highlighted that Solana (SOL) recently broke through a Channel Down pattern, showing a possible short-term reversal. This configuration indicates a potential 10 percent gain, and the targets are in a range between $160 and $167. The long-term trend is bearish, even though there is a positive short-term outlook. The traders should set a stop loss order at $136 to mitigate risks.
The support area is between $140 and $125, and the resistance area is between $160 and $180. The trend is up in the short term and is bullish, with strong momentum behind it, but the outlook still remains bearish in the medium to longer term.
Source: X
Solana’s Price Fluctuations Ahead
Solana has a Relative Strength Index (RSI) of 53.62, which shows a neutral market situation. It implies that both upward and downward price dynamics are possible. A reading close to 50 indicates that Solana is neither overbought nor oversold, indicating that currently, the market is in balance. Such neutrality exposes Solana to fluctuations in its prices, without a definite direction.
The MACD (Moving Average Convergence Divergence) indicator is at 1.01. The MACD line is above the signal line, indicating the presence of bullish momentum. It is a bullish indicator in favor of traders, implying that Solana might rise further as long as this bullish mood prevails in the market.
Source: TradingView
Short-Term Resistance Levels
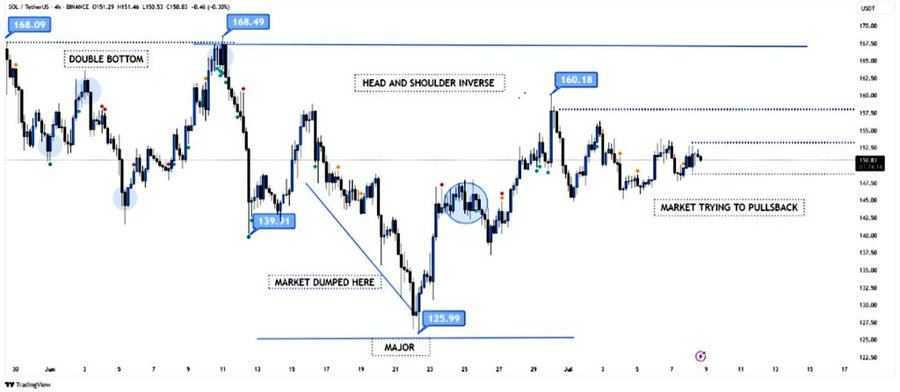
According to BitGuru, Solana is starting to move out of an intense decline to $125.99 after peaking at $168.49. The given cryptocurrency is developing a bullish inverse head and shoulders structure, indicating that the price might grow. SOL is now experiencing short-term resistance levels of $152.50 and $157.50, which will become important levels to monitor in the next few days.
Source: X
According to CoinGlass data, the volume is declining by 3.63%, totalling at $11.82 billion, and open interest has increased by 4.18% to $7.16 billion. The SOL OI-weighted funding rate is 0.0035% in the market which is a slight sign of optimism.
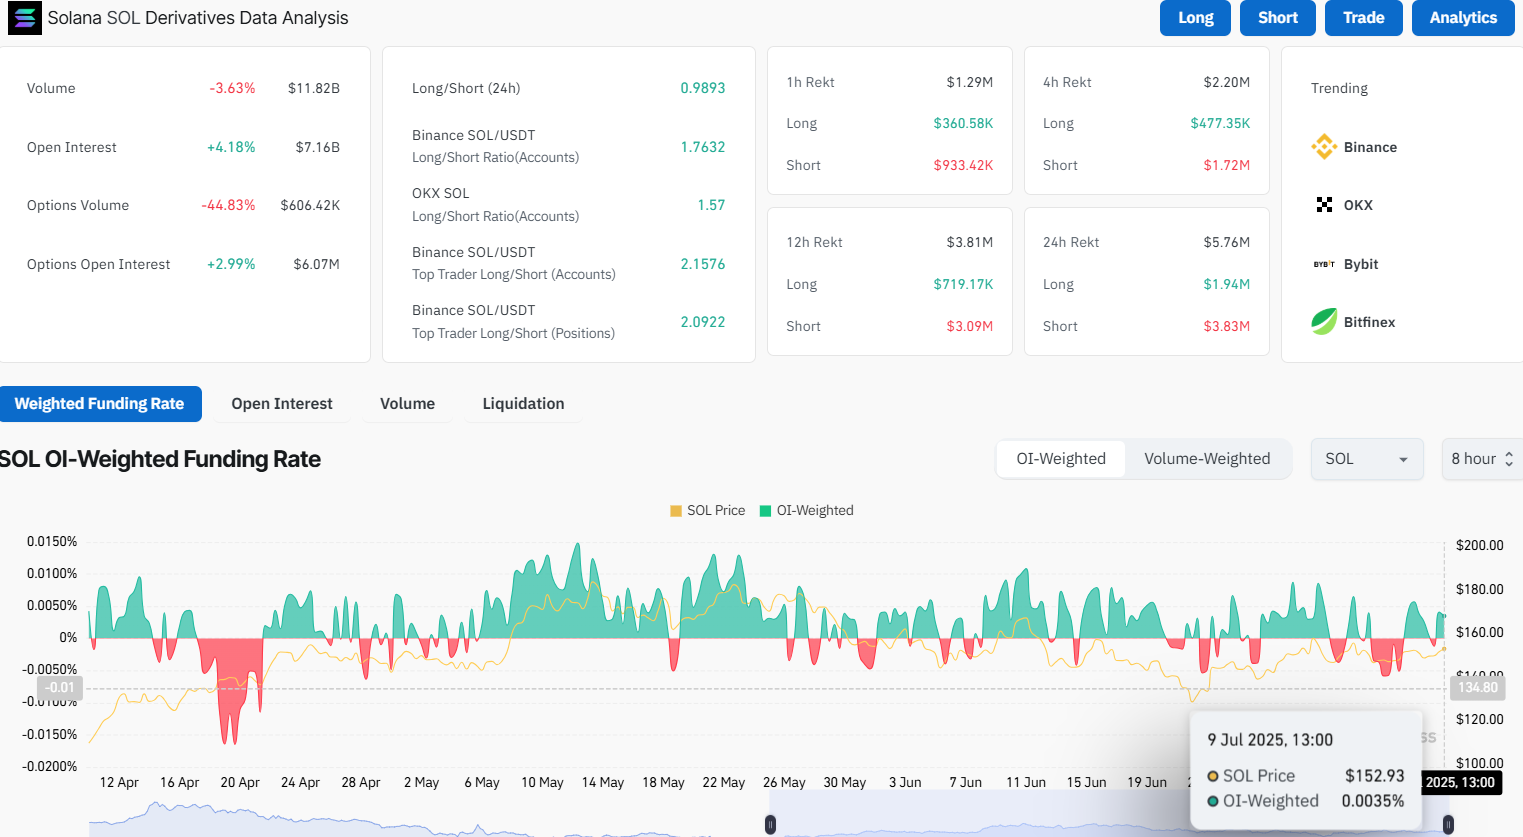
Source: CoinGlass
The price of SOL points to a bullish short-term perspective. Nevertheless, traders must be cautious because the medium to long-term outlook is still bearish. Market data and close monitoring of support and resistance levels will also play an important role in taking risks and the potential gains.
