Bitcoin’s Bull Run to Peak in October: Analyst Reveals Critical Price Charts You Can’t Miss

Strap in, crypto believers—the charts are flashing green. A top analyst just dropped the roadmap for Bitcoin's bull market crescendo, and October's the target.
The Countdown to Crypto's Big Bang
Forget hopium. These aren't scribbles on a napkin—we're talking hard technicals tracing Bitcoin's trajectory toward its next all-time high. The patterns mirror previous cycles, but this time, institutional money's fueling the rocket.
Why October? Blame the Halving Math
History doesn't repeat, but it rhymes. The four-year cycle post-halving suggests Q4 2025 is when the music stops. Of course, Wall Street will claim they predicted it all along—right after they finish dumping their bags.
Trade the Trend or Get Left Behind
Whether you're a diamond-handed HODLer or a leverage junkie, these charts are your cheat sheet. Just remember: in crypto, 'inevitable' usually means 'already priced in.'

Key Insights:
- Bitcoin price bull market peak expected September-October 2025 based on historical cycles
- Macro diagonal trend lines at 42 and 34 degrees show declining angle patterns
- Eight-degree trend line breaks preceded new all-time highs 214 days after halving
Analyst Rekt Capital predicts Bitcoin bull market peak for September-October 2025 using historical cycle analysis. Previous cycles showed peaks 518-550 days after halving events consistently.
Current cycle suggests 2-3 months remaining before potential top formation. Macro trend lines and diagonal patterns provide key technical indicators for timing market peaks.
Historical Halving Cycles Point to September-October Peak
Bitcoin price peaked 518 days after the 2016 halving event according to historical analysis. The 2020-2021 cycle extended slightly longer with peaks occurring 550 days post-halving. These timeframes place the current cycle peak between September-October 2025 based on patterns.
Cycle expansion appears natural with each four-year period adding approximately 30 days duration. The progression from 518 to 550 days shows consistent lengthening across cycles. Adding another 30 days brings the potential peak to 580 days after halving.

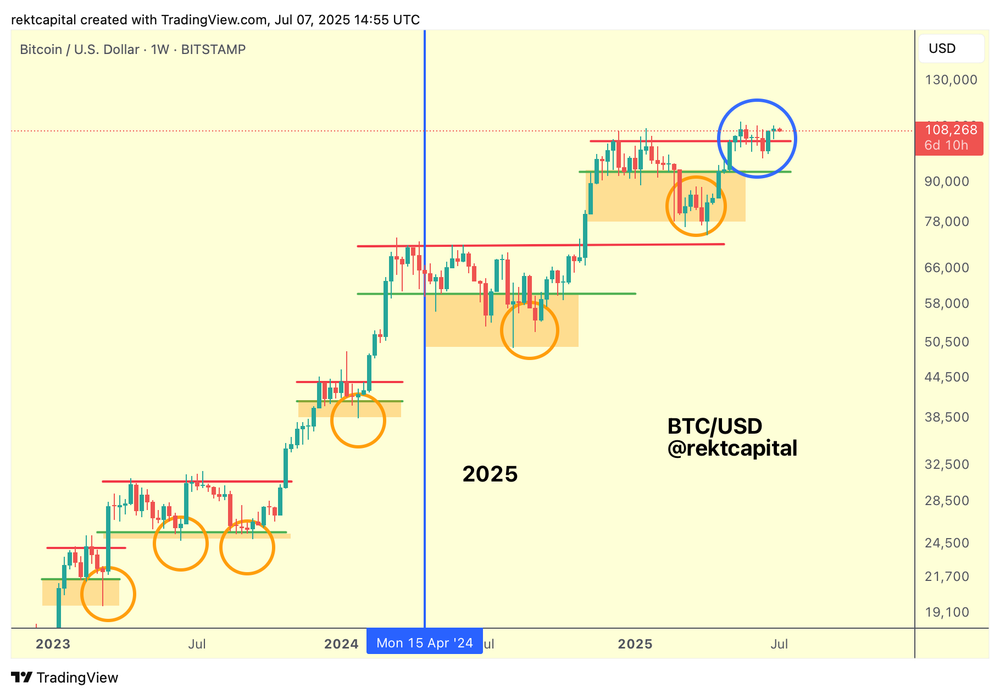
This extended timeline pushes the peak window into November 2025 under expansion scenarios. The current cycle sits in the orange circle zone with limited time remaining.
Historical standards suggest 2-3 months left before potential bull market conclusion. Rekt Capital identified the March 2023 bear market bottom around 20,000 levels accurately.
The analysis correctly predicted Bitcoin’s cycle acceleration following the triangular base breakdown. Price broke the downtrend in March 2023 leading to the current bull market phase.
The analyst tracks macro triangles and diagonal patterns across multiple cycles for timing.
These technical formations help outline both bull market peaks and bear market bottoms. Future diagonal formations will likely guide the next cycle’s acceleration phase.
Current positioning shows limited upside time remaining based on historical cycle comparisons globally.
Macro Diagonal Trend Lines Reveal Declining Angle Patterns
Bitcoin macro triangular charts expose recurring diagonal trend lines through many cycles throughout history.
The last cycle had a 42-degree angled macro diagonal when it was in the formation stage. The current cycle has a 34-degree angle diagonal which is an 8-degree drop.
This 8-degree fall consistently appears in all time horizons as well as in cycle analysis time horizons. This trend of decreasing angles forecast that the future cycles can keep declining. The next cycle could have a 26-degree angle in continuation of this trend.
These 8-degree angle trend lines reject price action during pre-halving times significantly.
Both the 2016 and 2020 cycles posted resistance at these precise angles. Breaking above them before creating formation of new all-time highs.
The breakout pattern occurs about 214 days after halving occurrences in cycles. That held true for both 2016 and 2020 cycle formations in both cases. The 2024 cycle established new all-time highs prior to halving unusually.
But the cycle still made new highs 214 days after halving upholding the pattern. It was the second new all-time high in the pattern of the ongoing cycle. The trend line break of 8-degree continues to be important in the explanation of pre-halving price rejections.
Future macro diagonals will likely occur at the 26-degree angle in terms of progression. These patterns are bases of support for a prolonged period before downtrend acceleration becomes prevalent.
Bitcoin Shows Periods of Cycle Underperformance and Overperformance
Bitcoin cycles alternate between underperformance and overperformance phases throughout their duration. The current cycle broke macro downtrend lines but moved sideways afterward.
This sideways movement showed underperformance compared to previous cycle acceleration patterns.
Earlier cycles displayed strong uptrend acceleration following macro downtrend breaks immediately. The current cycle’s consolidation phase contrasts with historical acceleration patterns observed.
This consolidation period already showed underperformance by comparative price action standards.
Bitcoin achieved new all-time highs prior to the halving event uniquely. This pre-halving performance completely outperformed all previous cycles in timing aspects. The achievement marked a period of overperformance within the current cycle structure.
Currently bitcoin enters another underperformance period following the pre-halving peak achievement. Future price action will likely overperform again to reduce this underperformance gap. These alternating patterns characterize typical Bitcoin cycle behavior across multiple timeframes.
The next bear market bottom will require watching the developing macro diagonal. Price compression will force downtrend acceleration following the established base formation. This base provides support for extended periods before breakdown occurs.
Future cycle planning requires understanding these overperformance and underperformance alternations.
Bitcoin could still break to new all-time highs during remaining months. Such breakouts WOULD reduce cycle expansion and potentially instill new acceleration phases.
