Polkadot Plunges to $3.36: Is a 93% Rally to $6.50 Next?

DOT bulls face a brutal test as Polkadot's price craters to $3.36—a far cry from its glory days. Can the interoperability token defy gravity and claw back to $6.50?
The anatomy of a comeback
Market makers are watching for three key signals: sustained buying pressure above $3.20, spot volume exceeding derivatives activity, and a break of the descending wedge pattern that's trapped DOT since Q1. Technicals suggest the $4.80 level could trigger stop losses for stubborn shorts.
Meanwhile, crypto influencers are busy pitching this as a 'generational buying opportunity'—just like they did before the last 80% drawdown. The real question isn't whether DOT can rally, but whether retail traders will fall for the same pump narrative again.

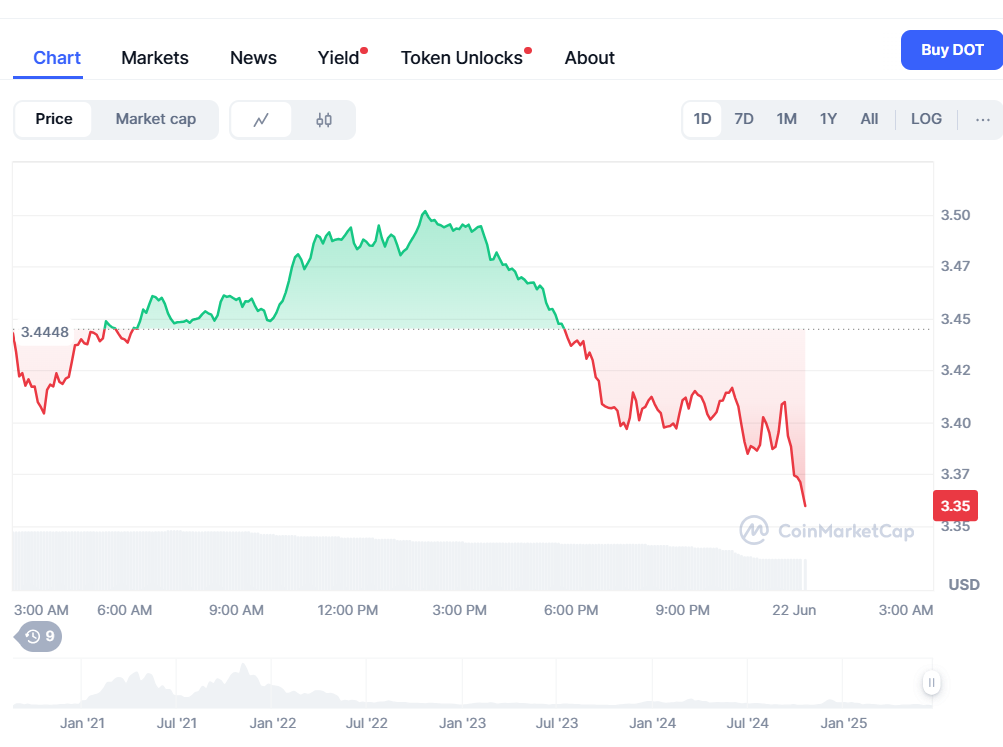
- DOT price holds at $3.36, reflecting a 10.47% weekly decline.
- Descending triangle pattern suggests bounce potential from $3.40 support.
- Forecasts for 2025 diverge: highs of $7.41 predicted, but lows around $3.46 also projected.
Polkadot (DOT) is currently navigating a precarious phase in its market trajectory, trading at $3.36, marking a 1.08% intraday drop and a steep 10.47% decline over the past week. Trading volume has notably shrunk by 44.97% to $132.22 million, signaling waning market participation.
According to technical analyst Khubab Nizamani, Polkadot is presently testing the lower boundary of a descending triangle on the daily chart, a technical pattern traditionally associated with bearish continuations. However, in this context, it may suggest the potential for a strong bounce from the $3.40 support level.
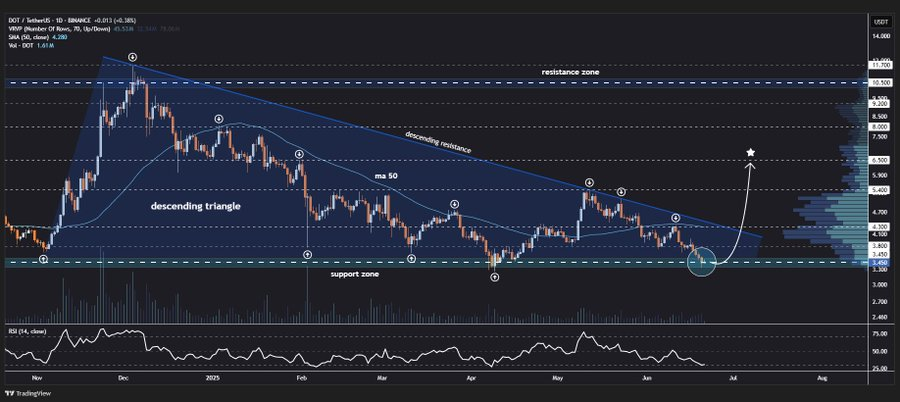
The descending triangle is well-defined, with a horizontal support line and a downward-sloping resistance, formed by sequential lower highs. Volume data underscores a possible breakout scenario.
Thinning volumes NEAR support may imply market indecision, while an upward spike could confirm bullish momentum. Price recovery targets have been outlined at $3.80, $4.30, $5.40, and ultimately $6.50, contingent upon a breakout above the resistance trendline.
Polkadot DOT price prediction for 2025 shows mixed outlook
Despite short-term technicals indicating possible upside, broader sentiment and forecasting models paint a fragmented picture of DOT’s 2025 trajectory. According to DigitalCoinPrice, DOT may approach $7.41 by year’s end, with potential to surpass its previous all-time high of $55.00, last observed in 2021.
The optimistic projection hinges on renewed investor interest and broader market recovery, especially as regulatory narratives and macroeconomic shifts shape the crypto landscape.
On the contrary, Changelly offers a far more conservative outlook, placing the average trading price of DOT in 2025 at just $3.49, with a high of $3.48 and a potential return on investment (ROI) of -16.1%. This assessment aligns more closely with current market conditions and technical pressure, emphasizing minimal movement and constrained growth.
Dot price risks breakdown if support fails
Convergence of patterns of the descending triangle by DOT around $3.40 identifies a significant technical area that should not be missed. If this level is successfully defended it could elicit bullish interest which may drive prices to the listed targets or above them.
Conversely, the bearish nature of the triangle could be confirmed if price fails at that level which in turn can drag Dot into more downside risk. Currently, Polkadot remains confined within a prominent support region and is neither bearish or bullish.
Market participants are advised to look out for the confirmation signs notably in key volume and momentum indicators before launching yet another winning trading position. The next couple of weeks can tell us if DOT will make a strong bounce back or it will slip into a lengthy consolidation period.
Related Reading | Polkadot Price Analysis: DOT Eyes $6.50 if Support Holds
