HBAR Plummets 11%—But Analysts See a Monster Rally Coming. Here’s the Catalyst

HBAR's nosedive has traders reaching for the panic button—but the smart money's loading up. Here's why this dip might be the gift that keeps on giving.
Blood in the streets? More like a fire sale. While retail investors flee, institutional players are quietly accumulating HBAR at these levels. The network's enterprise adoption is accelerating faster than a DeFi exploit drains wallets.
Technical indicators scream oversold. The 11% drop looks brutal—until you zoom out to HBAR's 2025 institutional adoption curve. Hedera's governance model (you know, the thing that actually prevents catastrophic forks) is finally getting its due.
Prediction: This 'crash' will be remembered as the last discount before HBAR joins the big leagues. Just don't tell the Bitcoin maxis—they're still waiting for their 'store of value' to actually do something useful.

- Hedera (HBAR) is showing signs of potential bullish reversal after recent declines.
- Technical indicators suggest a breakout may occur if the price surpasses $0.151.
- Forecasts for 2025 predict steady growth, with potential ROI reaching 36.2%.
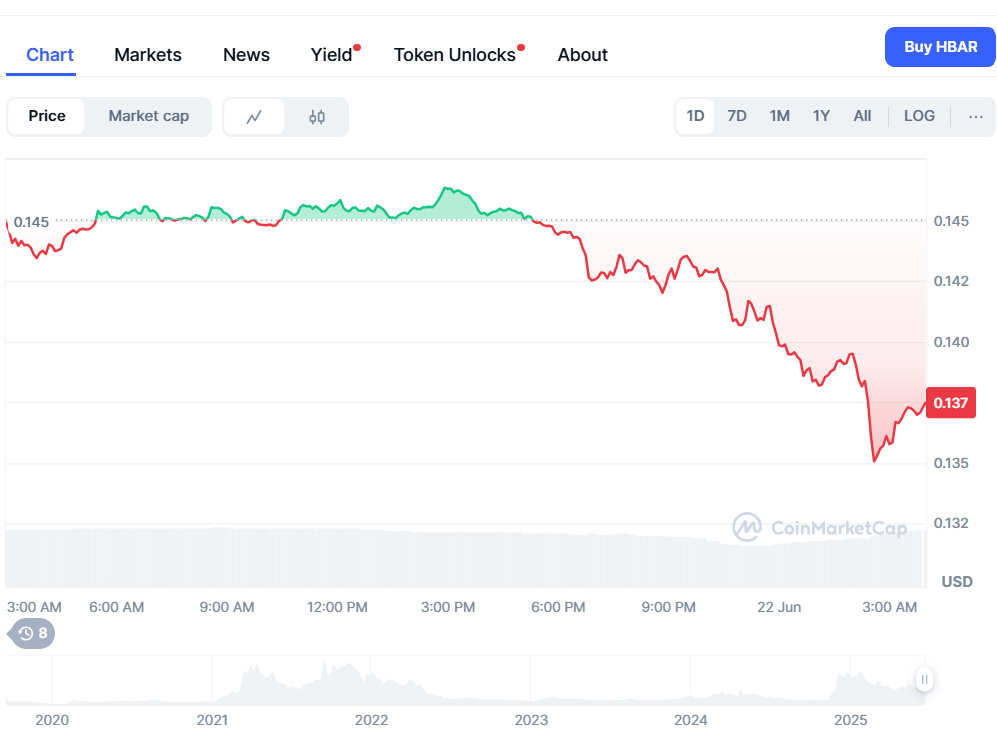
Hedera’s native token, HBAR, is currently trading at $0.1374, showing a 4.33% drop over the last 24 hours, and it has lost around 11.31% of its value in the past week, with trading volume within the same period down by 1.07% to $113.82 million.
Despite this recent downtrend, there are analysts who propose that some FORM of a short-term reversal pattern may be emerging as per the technical setup.
Popular crypto analyst Ghoul_Meta says HBAR has strong support around $0.1449. The price has recently stopped falling and started to steady at this level after dropping since late May. The price has been moving under a downward trend line, but it’s now testing that line.
If the price clearly breaks above $0.151, it could start rising toward $0.181, a 25% increase from where it is now. Experts suggest watching indicators like the MACD and RSI to confirm the move. Right now, the chart shows growing positive momentum, with buying activity starting to beat selling pressure.
Moving average crossover hints at trend shift
The chart gives a clear look at how HBAR’s price is moving. Around the $0.1449 level, the price has tried to drop but keeps bouncing back, showing strong buying support. A downward sloping line connecting recent lower highs now meets the $0.151 resistance area. This point could decide where the price goes next.
The candlesticks have turned more predominantly green which increases the current short-term sentiment to be more bullish in nature. The moving averages (probably the 50- and 200-period) hint at a golden cross being formed soon, which is a typical bullish signal.
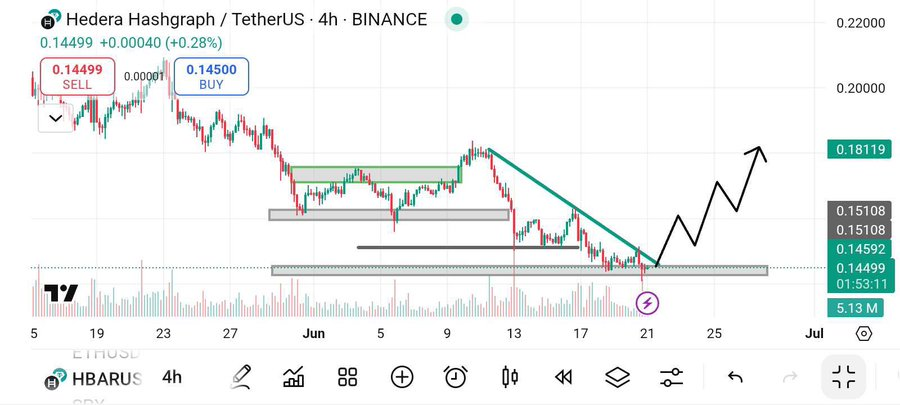
Besides, the rising volume bars during an attempted breakout let one suppose that momentum traders are opening their positions, which merges excellently with pattern-based trading strategies.
If HBAR can strongly move above $0.151, many technical traders believe the next target could be around $0.181, which adds to the growing confidence in short-term gains.
HBAR shows long term growth potential
HBAR might struggle in the short term, but experts think 2025 looks promising. DigitalCoinPrice says the price could go above $0.30 by the end of the year and might even reach its old high of $0.57. Changelly also expects HBAR to trade between $0.1780 and $0.2052, with an average around $0.1840. They estimate a possible return on investment of 36.2%.
Even as June 2025 may see fluctuations, projections suggest HBAR could maintain levels above $0.1480, lending credibility to bullish breakout expectations forming in late June. As always, investor caution is warranted, but the groundwork appears to be laid for a price rebound if technical thresholds are cleared.
Related Reading | HBAR Approaches Make-or-Break Zone with $0.098 in Bearish Crosshairs
