Dogecoin Primed for 60% Surge as It Shatters Critical $0.22 Barrier

Dogecoin—the meme coin that refuses to die—just flipped a key resistance level into confetti. Traders are now eyeing a 60% rally as DOGE bulls charge past $0.22.
The breakout play
No fancy fundamentals here—just pure, unfiltered chart gravity. The $0.22 ceiling had been choking DOGE for weeks until today's breakout. Now, the path looks clear for a run toward $0.35.
Why this matters
Because in crypto-land, technicals trump everything—even common sense. A 60% pump would put Dogecoin back on retail traders' radar, right as Wall Street starts another 'blockchain is the future' PowerPoint.
The cynical take
Let's be real: this is the same 'fundamental analysis' that had people buying DOGE at $0.70 because Elon tweeted a Shiba Inu. But hey—if the charts say buy, the degens will come. Just don't mortgage your house this time.

- Dogecoin ($DOGE) consolidates between $0.16 and $0.22; analysts anticipate a 60% breakout move.
- The current price at $0.1690 reflects a 9.96% weekly drop and 0.99% daily rise amid falling volume.
- Market sentiment hinges on technical indicators; long-term projections show potential upside.
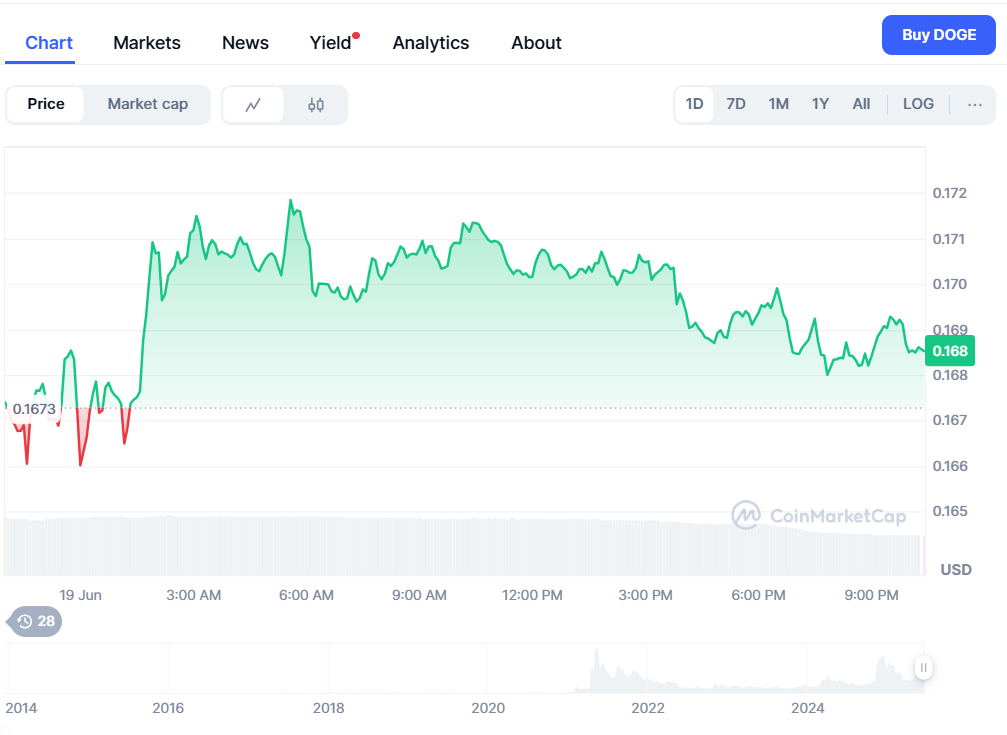
Dogecoin (DOGE) is currently trading at $0.1690, up slightly by 0.99% in the last 24 hours. But in the past week, it has dropped by almost 10%. At the same time, daily trading volume has fallen a lot, down 34.14% to about $677.92 million.
This drop in trading shows that investors might be less interested or more cautious. Right now, Doge is moving within a narrowing triangle pattern, which usually comes before a big price move up or down. Traders are watching closely for a clear breakout to know where the price will go next.
Long-term charts show converging trendlines in DOGE
On a long-term technical chart, there is a pattern that forms between early 2024 and mid-2025 that has converging lines, and then prices develop lower highs and higher lows. This sign is an indication that pressure is building up.
Crypto analyst Ali says the symmetrical triangle pattern shows that big price changes are coming soon. He explains that if the price closes above $0.22 or below $0.16 on a daily chart, it will likely show the next direction. If it closes above $0.22, the price might go up to around $0.35 or $0.36, which is about 60% higher.
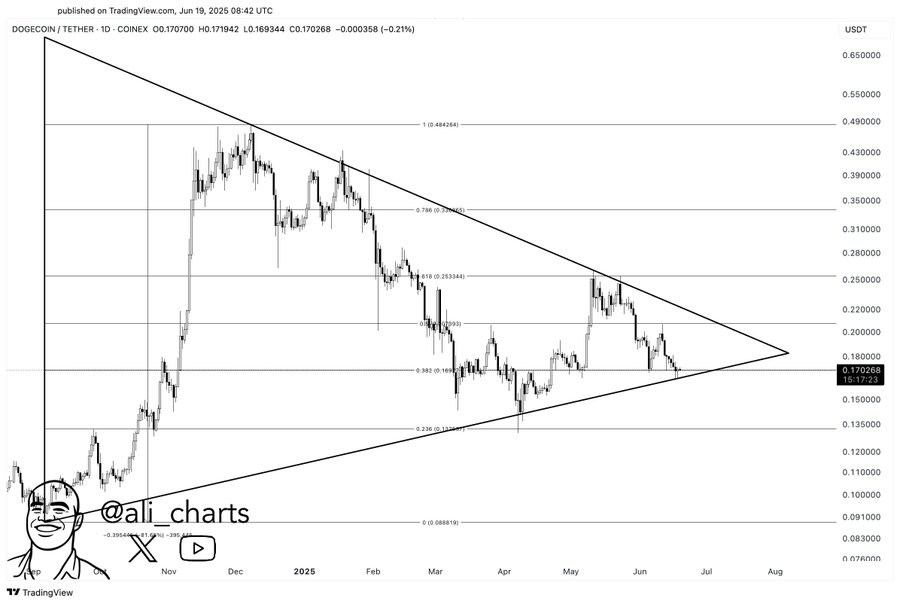
But if Dogecoin falls below $0.16, the price could drop to about $0.10, meaning a downtrend. The triangle pattern makes it clear that the fluctuations in prices are diminishing as the tip of the triangle gets closer by June 2025. Typically, this type of pattern is a signal of a large move ahead, but experts advise that without strong trading volume, it is not easy to be absolutely sure.
The candlestick charts give an indication that there exists indecision amongst traders currently, yet based on past trends, eventually there might be a very sharp price change as price approaches closer to the tip of the triangle.
Dogecoin price prediction for 2025
Technical signals suggest a price breakout might happen, but experts don’t all agree. Changelly expects DOGE to trade between $0.162 and $0.203 in June 2025, with an average price around $0.172, which is close to where it is now. They also point out that the 50-day moving average is going down, which means the NEAR future might be a bit uncertain.
On the other hand, DigitalCoinPrice is more hopeful. They predict Dogecoin could go over $0.37 before the end of the year and might even reach its highest price of $0.74 again. Investor feelings and past trends show that the coin’s price could rise quickly after a breakout, especially if the overall crypto market is doing well.
Related Reading | dogecoin Predicted To Rise by 600% Toward $1.25, Here’s When?
