Bitcoin Demand Lags—But Why Aren’t Sellers Crashing the Market? (2025 Update)

Bitcoin’s price action feels like watching a heavyweight boxer dodging punches—demand’s sluggish, but the sell-side keeps whiffing. Here’s how BTC keeps absorbing pressure without collapsing.
The Demand Drought: No sugarcoating it—retail and institutional inflows are thinner than a DeFi whitepaper. Yet Bitcoin’s trading range holds tighter than a VC’s purse strings during a bear market.
Absorption Mode: Miners and long-term holders aren’t panic-dumping (yet). OTC desks keep quietly mopping up supply, proving even crypto’s 'weak hands' have diamond fingerprints these days.
The Cynic’s Corner: TradFi analysts still waiting for Bitcoin’s 'inevitable collapse' might want to check their Bloomberg terminals—this isn’t 2018 anymore. Though if you listen closely, you can hear goldbugs sharpening their 'told-you-so' tweets.
Bitcoin Consolidates Above $100K as Demand Weakens
Bitcoin has consistently held above the $100,000 level since early June, signaling that a new price equilibrium may be forming. Despite the strong performance—up 40% since the April lows—the price has struggled to break through the $112,000 all-time high, raising questions about the sustainability of the current trend. The longer BTC fails to reclaim new highs, the greater the risk of a breakdown below $100K, especially if broader macroeconomic and geopolitical pressures intensify.
Darkfost shared insights highlighting a shift in market behavior. While there was a brief uptick in profit-taking yesterday, the volume remained relatively low. This suggests that most investors are still inclined to hold, indicating confidence in Bitcoin’s longer-term trajectory. However, a key factor preventing upward continuation is the visible weakness in demand.
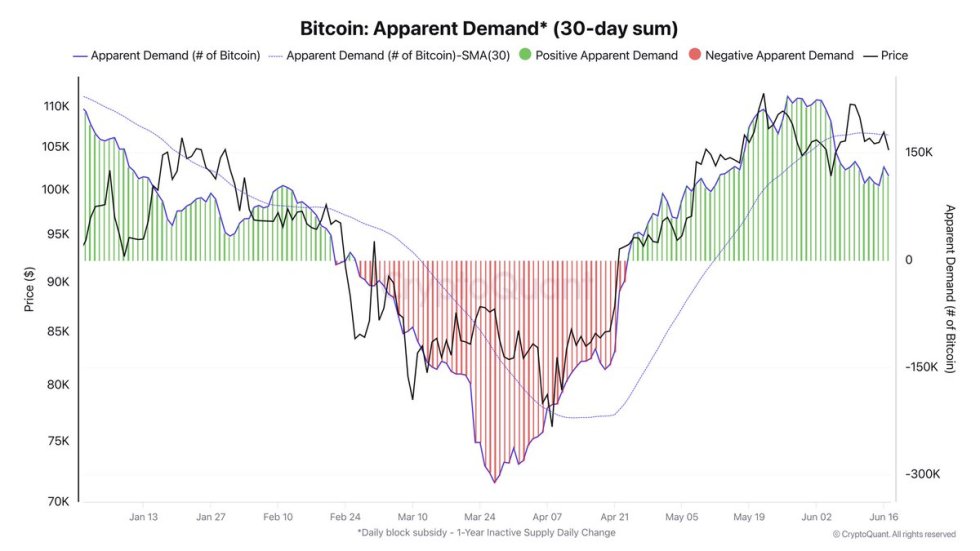
Darkfost pointed to a chart comparing new supply to the over 1-year inactive supply, used to measure relative demand strength. When this ratio climbs above zero, it typically signals increasing demand. However, since the most recent local top in May, this metric has been gradually declining. Although demand remains healthy enough to absorb existing selling pressure, it’s insufficient to drive another breakout.
At present, Bitcoin appears locked in a state of balance, supported by steady holder conviction but restrained by subdued new buyer activity. If demand returns with force, a breakout toward new highs could follow. Until then, the market remains in wait-and-see mode.
BTC Price Analysis: Key Support Still Holding But Momentum Weak
Bitcoin is currently trading around $104,827, showing signs of hesitation as it consolidates just above the key support zone NEAR $103,600. This level, which aligns with a previous all-time high, continues to act as a critical line in the sand for bulls. The 12-hour chart shows repeated tests of this support since early June, each time followed by a recovery, but without meaningful follow-through to the upside.
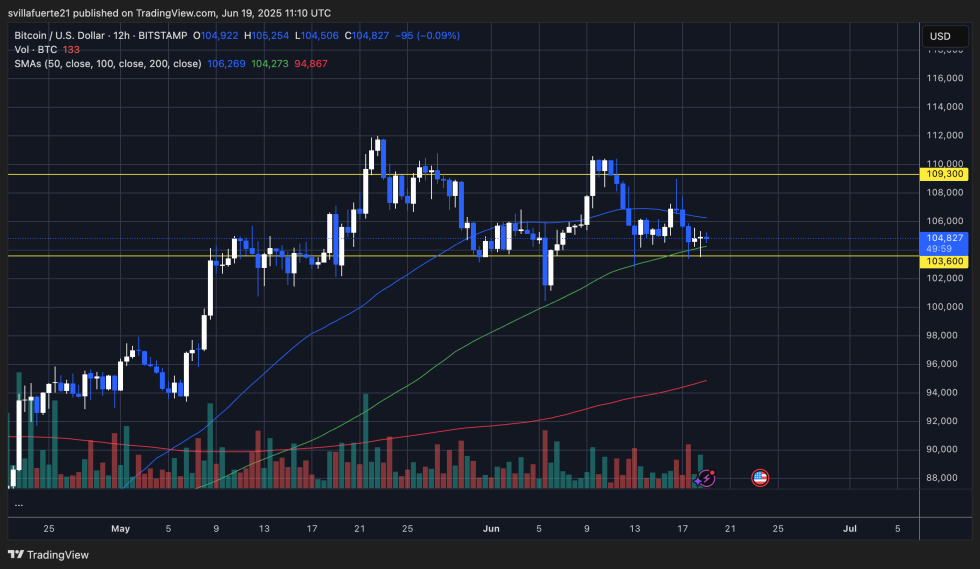
The 100-period moving average (green line) is providing dynamic support just above $104,200, while the 50-period MA (blue line) now acts as overhead resistance around $106,269. This squeeze between moving averages indicates a tightening range, and a breakout — up or down — could occur soon. Volume remains relatively low, which suggests a lack of conviction from both buyers and sellers.
Upside remains capped by the $109,300 resistance level, which Bitcoin failed to reclaim in multiple recent attempts. A clean break above this level could reignite bullish momentum toward price discovery. However, continued failure to breach that zone, combined with global uncertainty and weakening demand, increases the risk of a breakdown below $103,600 — opening the door to a deeper correction. For now, Bitcoin holds the line, but pressure is building.
Featured image from Dall-E, chart from TradingView
