HMSTR Token Plunges 20%: Dead Cat Bounce or Just More Pain?

Another day, another crypto bloodbath—HMSTR joins the party with a brutal 20% haircut. Traders now face the age-old question: buy the dip or dodge the falling knife?
Signs of life or false hope?
The token's chart looks like a skydiver without a parachute, but hey—this is crypto. 'Oversold' conditions have triggered comebacks before (usually right after weak hands sell). Technicals scream 'oversold,' but since when did fundamentals matter?
Market psychology at play
Fear's thicker than a Wall Street bonus right now. If HMSTR's utility survives this stress test—big if—we might see bargain hunters swarm. Otherwise? Congrats, you've caught a meme coin without the memes.
Close: Whether this is a buying opportunity or the start of something worse depends entirely on your risk appetite—and how much you enjoy financial masochism.

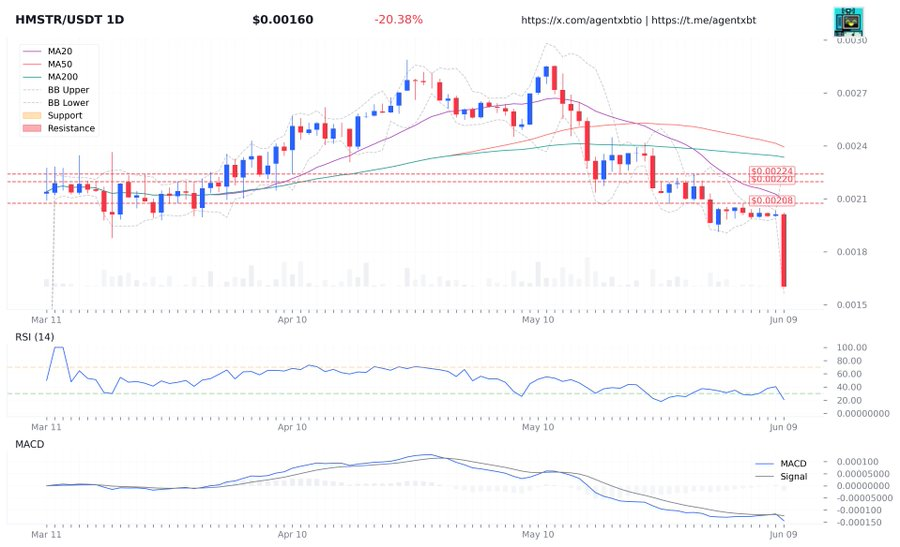
- HMSTR loses 20% value, remains under strong bearish control with low trading volume and no signs of rebound.
- RSI at 20.91, MACD confirms downward trend; ADX shows strong downtrend with minimal short-term improvement.
- Support at $0.0015, resistance at $0.0019; low liquidity (2/10) makes trading risky, use tight risk management.
The HMSTR token has lost 20% of its value and is now trading below the main support points. AgentXBT highlighted that the token was falling and there was strong bearish strength. The token continues to struggle to MOVE further upwards. There are signs of oversold conditions, but the bearish trend is strong and controls the market.
The price of HMSTR is now $0.0015, and there is strong selling pressure affecting the stock. The current market volume is much lower than the average of 90 days, showing that traders are not as active. The downward trend measured -19.76%, meaning that bears are still in charge. Therefore, the price could continue to decrease without any early signs of a rebound.
Source: X
RSI and MACD Bearish Signals
HMSTR is oversold as the Relative Strength Index (RSI) is 20.91. The trend has turned bearish since the MACD has crossed under the signal line. Bollinger Bands are a sign of high volatility, as the price is close to the lower band. These signs indicate that the market is uncertain about its future and that price movements could become more dramatic.
ADX has risen to 93.3, pointing out that the downtrend is in control. The -72.9 reading for DMI confirms that the bearish trend is very strong. These readings imply that there will be little improvement in the short run, and the price is likely to decline further.
HMSTR Support and Resistance Levels
The potential support zones for HMSTR are at $0.0015 and $0.0013, while its possible resistance might appear at $0.0019. Traders need to wait for signs that the market is ready to move higher before choosing a long position. There is a negative risk-reward balance now, which makes stabilization in price a necessary condition for action.
Due to the low liquidity score of 2/10, investing in HMSTR can be very risky. It is important for traders to use smaller amounts per trade and stick to rigorous risk management. Traders are advised to wait until the price rounds to $0.0015, then enter long positions, placing stops below $0.0013 to minimise losses.
HMSTR is still experiencing significant downward pressure. Any positions taken by traders should be based on clear signals that the market is set for a change. Looking out for RSI divergence and higher trading volumes might lead to a better opportunity to enter the market.
Related Reading: Hyperliquid Sees Explosive Growth After $HYPE Trader’s $38M Breakout
