Cosmos (ATOM) Defies Gravity—Will the Rally Ignite?

Support levels for ATOM are holding firm—despite the broader market's existential crisis. Traders whisper about an impending surge, but will it materialize or just another crypto head-fake?
Key levels to watch: If ATOM punches through resistance, the next stop could be a 30% climb. Fail? Well, there's always another 'next big thing' in this casino.
Bonus jab: Meanwhile, Wall Street still thinks 'blockchain' is a type of Scandinavian furniture.

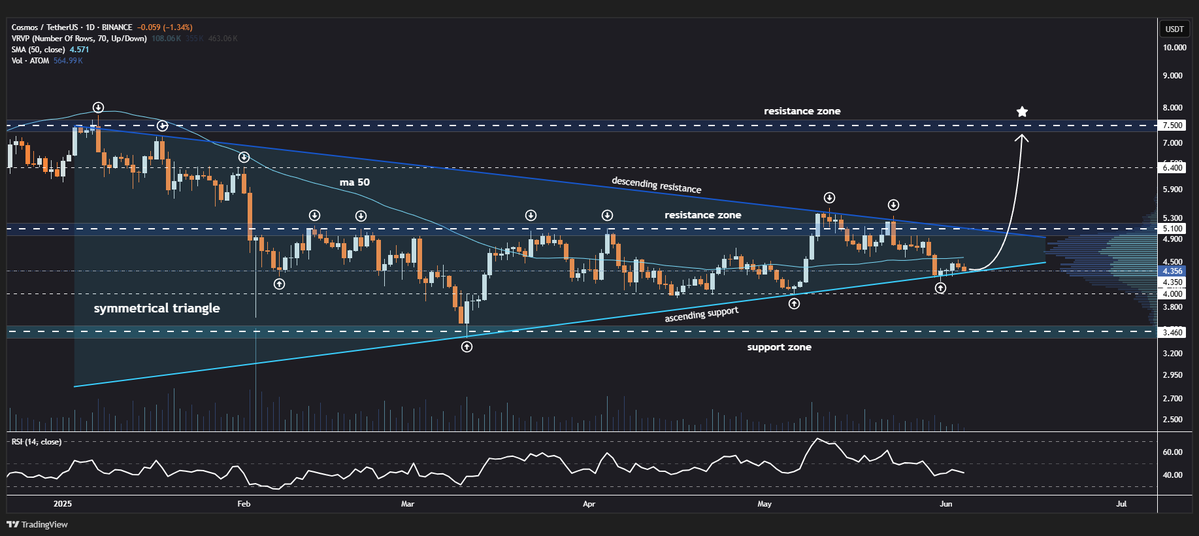
- The price of Cosmos (ATOM) is still above a significant symmetrical triangle, indicating a bullish breakout might be incoming.
- Breaking above the 50-day MA and dropping below the resistance could cause rises to $5.10, $6.40, and $7.50.
- The bigger picture of ATOM’s chart shows there may be signs of a rising price after recent bearish moves.
Cosmos (ATOM) has remained strong by keeping a grip above a key support level in a symmetrical triangle on the daily chart. Jonathan Carter, a crypto analyst, thinks that if current factors stay the same, the triangle pattern might lead to a bullish outcome.
Source: X @JohncyCrypto
Usually, a symmetrical triangle points to a time of trading pause until a strong price trend starts heading in one or the other direction. But since ATOM has not fallen below the triangle’s lower edge, the trader expect an uptrend may happen soon.
A Surge Gets Confirmed Only When ATOM Break Through a Descending Resistance
Carter advised investors to keep an eye on the 50-day moving average (MA 50) in the short run. A break above $3.7 might trigger a rally that brings ATOM prices higher.
His prediction is that if momentum remains, the next levels of potential resistance could be found at $5.10, $6.40 and later on $7.50. These price points are located within areas identified in the past where price movements have been visible.
The analysis of the chart also pinpoints a descending resistance line which the price WOULD need to overcome before continuing the uptrend. Thus far, the ATOM token is trading above the sloping support provided by the triangle, which is good news for buyers.
The projection formed by the candle on Carter’s chart shows a likely breakout after hitting the support and toward reaching the higher targets.
Momentum Slowing, Though Bullish Signals Are Still Right in Place
On TradingView, $4.35 is shown as the price of ATOM, which is down by roughly 1.5% from the previous day’s price, with momentum indicators giving conflicting signals. The token is not yet oversold according to the RSI which is currently at 41.70.
Furthermore, a bearish crossover could be spotted on the MACD, indicating short-term instability or holding before a stronger trend sets in.
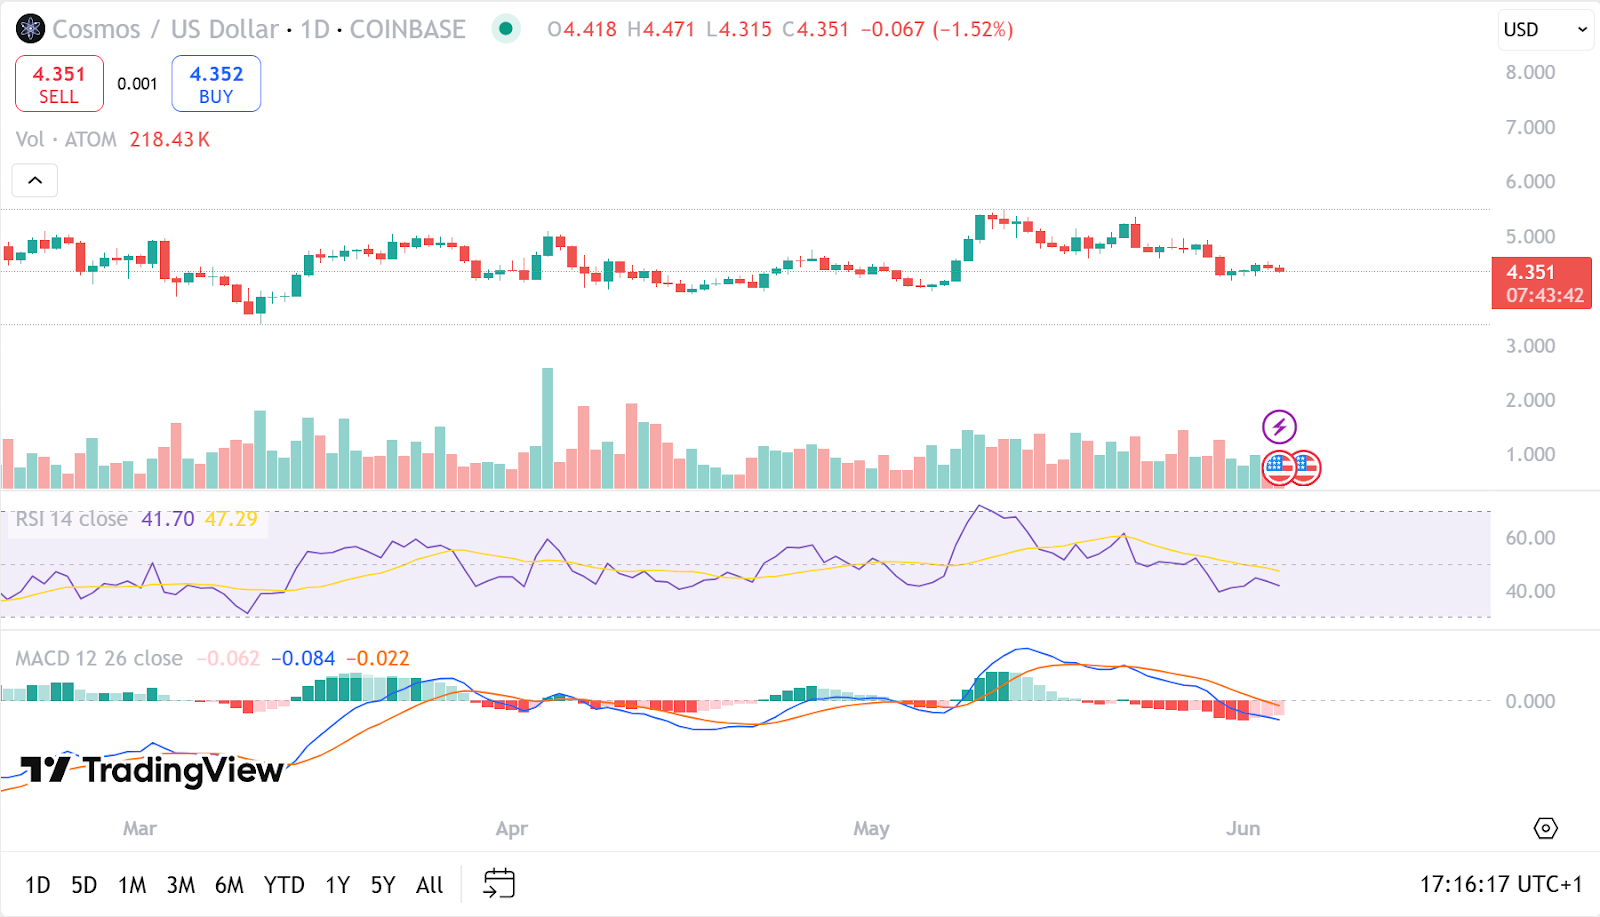
Source: TradingView
