PENGU Defies the Bears: Double Bottom Pattern Signals $0.01650 Breakout Imminent

Looks like the meme coin crowd isn’t just flapping their wings—PENGU’s chart is forming a textbook double bottom, the kind of setup that makes technical analysts reach for their buy orders. The target? A juicy $0.01650 if resistance cracks.
Forget ’fundamentals’—this is crypto, where patterns and vibes move markets faster than any whitepaper. And right now, the vibes are screaming bullish. Just don’t tell the SEC.
Will PENGU soar or faceplant like so many altcoins before it? Either way, grab your popcorn—and maybe a risk management strategy while you’re at it.

- PENGU is forming a bullish double bottom pattern on the 4-hour chart, indicating a potential trend reversal.
- Key resistance lies between $0.01450 and $0.01500; a breakout could push the price toward the $0.01650 target.
- Momentum is shifting bullish as $PENGU trades above both the 9 EMA and 50 SMA, supported by increasing volume.
Pudgy Penguins (PENGU) is on the way to its positive trajectory and forming a double bottom pattern on the four-hour time frame, which often indicates a bullish reversal. Now the overall market has turned from bearish to bullish as BTC is moving toward its resistance around $112k. PENGU is trying to attempt its resistance zone around $0.01650. If a successful breakout occurs, it will lead to short-term or long-term recovery.
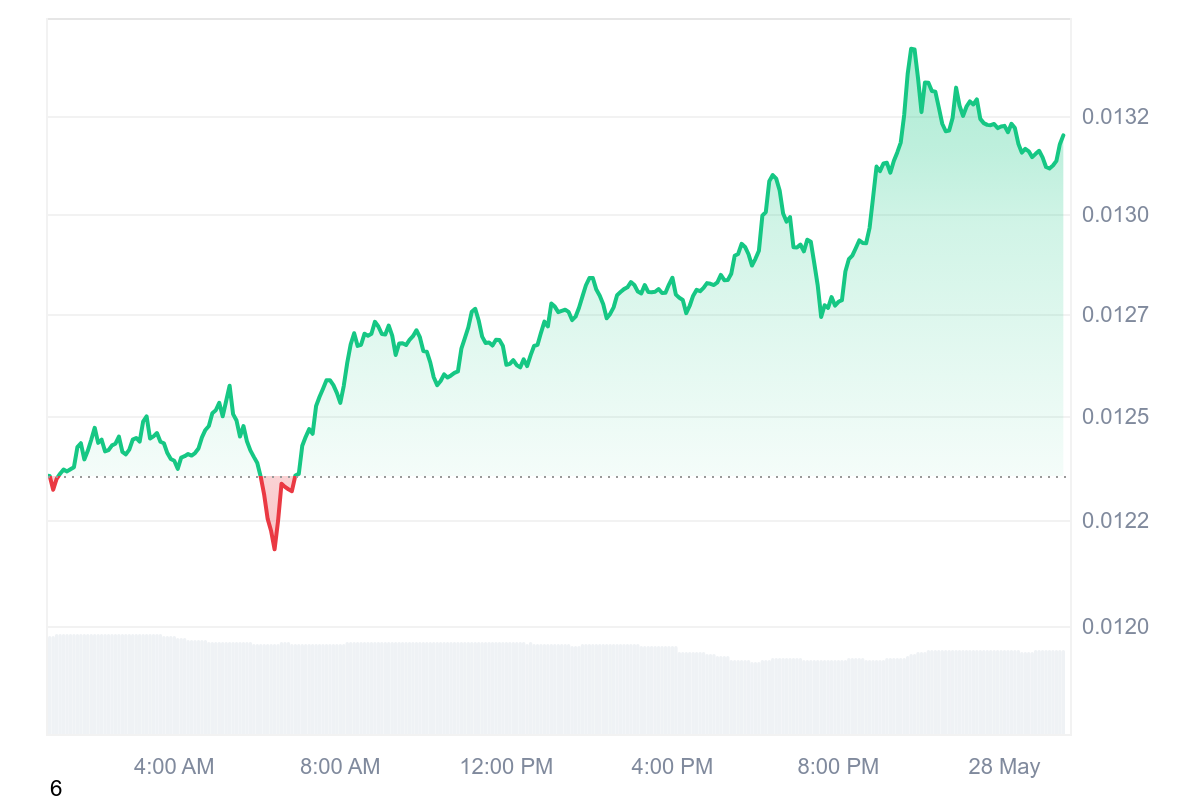
At the time of writing, PENGU is trading at $0.01320 with a 24-hour trading volume of $83.4M and a market cap of $830.33M. The PENGU price over the last 24 hours is up by 6.78%, and over the last week its price is up by 5.72% and showing high potential for both short-term and long-term recovery.
Source: CoinMarketCap
PENGU Targets $0.01650 After Reversal Setup
According to a prominent crypto analyst, PENGU is currently showing signs of a potential bullish reversal on the 4-hour timeframe, as it begins to form a classic double bottom pattern. Price has twice found support around the $0.01200 level, where buying interest emerged strongly on each dip. These reactions suggest that a demand zone is taking shape, Setting the stage for a potential shift from bearish to bullish sentiment.
The crucial resistance zone, or neckline of the chart formation, is in the range of $0.01450 to $0.01500, levels that served to stall earlier. Several rejections within this range over recent days make it a crucial point that has to be taken by the bulls. A firm breakout above the neckline, preferably backed by solidly increasing volumes, will confirm the chart pattern and ignite a buying wave.

Source: X
If the breakout is confirmed, it will lead to the $0.01650 area, which is the logical next resistance area on the chart. A continued MOVE through that could signal even larger potential to the upside, potentially attracting new momentum players and speculators looking to ride the wave. For this time, the setup is speculative and technically attractive.
Contributing to the positive bias, PENGU has been able to break above its 50-period SMA and 9-period EMA on the 4H chart. The crossover of major moving averages is a sign of positive short-term momentum and makes the case stronger for a trend reversal. As the higher low formation is in place, investors will look cautiously for a breakout confirmation and follow-through to the upside.
Related Reading: shiba inu Forms Bull Flag Pattern, Breakout Could Trigger Surge to $0.000022
