XRP’s W Formation Sparks Wild 600% Price Surge Speculation

Technical traders are buzzing as XRP paints a textbook W formation—a classic bullish reversal pattern. Could this be the launchpad for a sixfold price explosion?
Market veterans eye the setup with cautious optimism. ’W patterns often precede major breakouts,’ notes one analyst, ’but in crypto, even the prettiest charts can get rug-pulled by whale games.’
The 600% growth forecast hinges on the pattern completing its second leg. If resistance breaks, the math suggests a rally to levels not seen since the 2021 mania.
Meanwhile, skeptics remind us that TA is astrology for finance bros—especially when SEC lawsuits still loom over Ripple. Either way, grab your popcorn: this technical drama beats watching another stablecoin hearing.

- Ripple’s (XRP) market cap analysis highlights potential growth, with predictions showing two contrasting outcomes.
- The W formation pattern has proven reliable in predicting XRP’s price growth in previous cycles.
- Forecasts suggest XRP could see price increases of 242% to 600% based on market cap projections.
Analysis of Ripple’s (XRP)potential price is ongoing, with meaningful predictions coming from market cap assessments. Even though market cap is common among investors, it can lead beginners to make wrong decisions. The actual liquidity or worth of a coin is not always shown by its trading price. Analyzing it correctly, it can give us useful information about the potential of token.
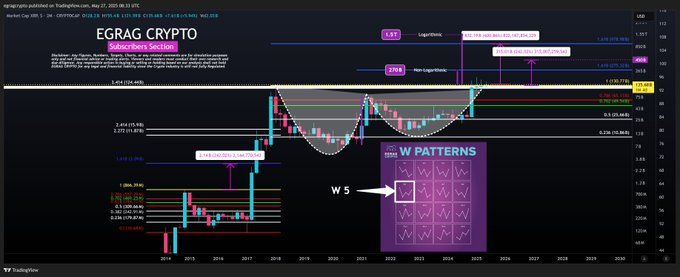
Egrag noted that the W formation pattern was visible on XRP’s market cap chart on repeated occasions. This trend has turned out to be a good indicator of upcoming growth in the past. Since token tends to move with this formation, its price is expected to look good in the NEAR future. This model is vital to reveal where XRP may fare in the next market cycle.
XRP’s Market Potential: Two Growth Paths
Two methods were applied to determine XRP’s market potential: logarithmic and non-logarithmic analysis. The traditional way of estimating puts token market cap around $270 billion which matches Fibonacci level 1.618. Yet, the logarithmic model leads to a suggested market cap of $1.5 trillion, pushing past the Fibonacci level by $500 billion. Both models paint two very different but possible outcomes for XRP’s progress in the future.
Source: X
Forecasts indicate that coin could see over three times (242%) and 600% more growth as new estimates are expected. Being a part of cryptocurrency’s normal cycle, the 242% gain, whereas, the 600% surge could signal bigger future gains. Both cases show that coin might go up a lot in its price in the near or more distant future.
XRP’s Growth Targets
The analysis identifies four key targets for token-based on these growth estimates. The first target for emissions, $270 billion, matches the W curve. The 242% growth of this second target, to reach $450 billion, is much like the increase seen in the previous cycle. The target of $978 billion includes a higher estimate for the growth area, as it represents a rise of 242%. The maximum growth is suggested to be $1.5 trillion when using the logarithmic growth model.
Since the circulating supply of roken is 58.68 billion, these market cap numbers point to significant prices the token could reach. If growth continues as foreseen, cryptocurrency’s value could strongly increase. This review gives investors a better idea of where the price of XRP might go in the future.

Source: X
Even though Ripple’s market cap by itself does not guarantee anything, its historical value and projections help predict its future direction. There is still a lot of room for growth, as many scenarios show that prices may MOVE up and down significantly in the upcoming years.
