XCN Teeters on the Edge: Can Chain Smash Through the $0.01750 Ceiling?

XCN bulls are coiled like a spring—again. The token’s fifth attempt this month to breach $0.01750 could trigger a 20% rally if historical patterns hold. But let’s be real: ’resistance levels’ in crypto are just collective hallucinations until some whale decides to move the goalposts.
Technical indicators show bullish divergence on the 4-hour chart, while trading volume creeps toward 30-day highs. Meanwhile, ’institutional adoption’ rumors swirl—because nothing pumps bags like vague nods to Wall Street’s shadowy crypto desks.
Either way, grab popcorn. This is either the breakout traders have been waiting for... or another masterclass in how crypto turns ’key levels’ into emotional support lines.

- Despite recent declines, overall market sentiment remains positive, potentially supporting a rebound in XCN.
- Key support is holding near $0.01600, with resistance at $0.01750 acting as the breakout trigger zone.
- The MACD shows continued bearish convergence, while the RSI approaches oversold levels, hinting at a possible reversal.
XCN is on the verge of a breakout and moving towards its resistance zone around $0.01750. Overall market sentiment is positive, which also propels the altcoins, including XCN. However, technical indicators are showing signals of a bullish trend. Both traders and investors are closely watching XCN. If a successful breakout occurs, it will lead to the maximum bonus.
At the time of writing, XCN is trading at $0.01644 with a 24-hour trading volume of $29.35M and a market cap of $551.6M. However, the XCN price is hit by market volatility, and over the last 24 hours, its price is down by 4.72%, and over the last week, it is down 8.17% but also showing signs for the next major journey.
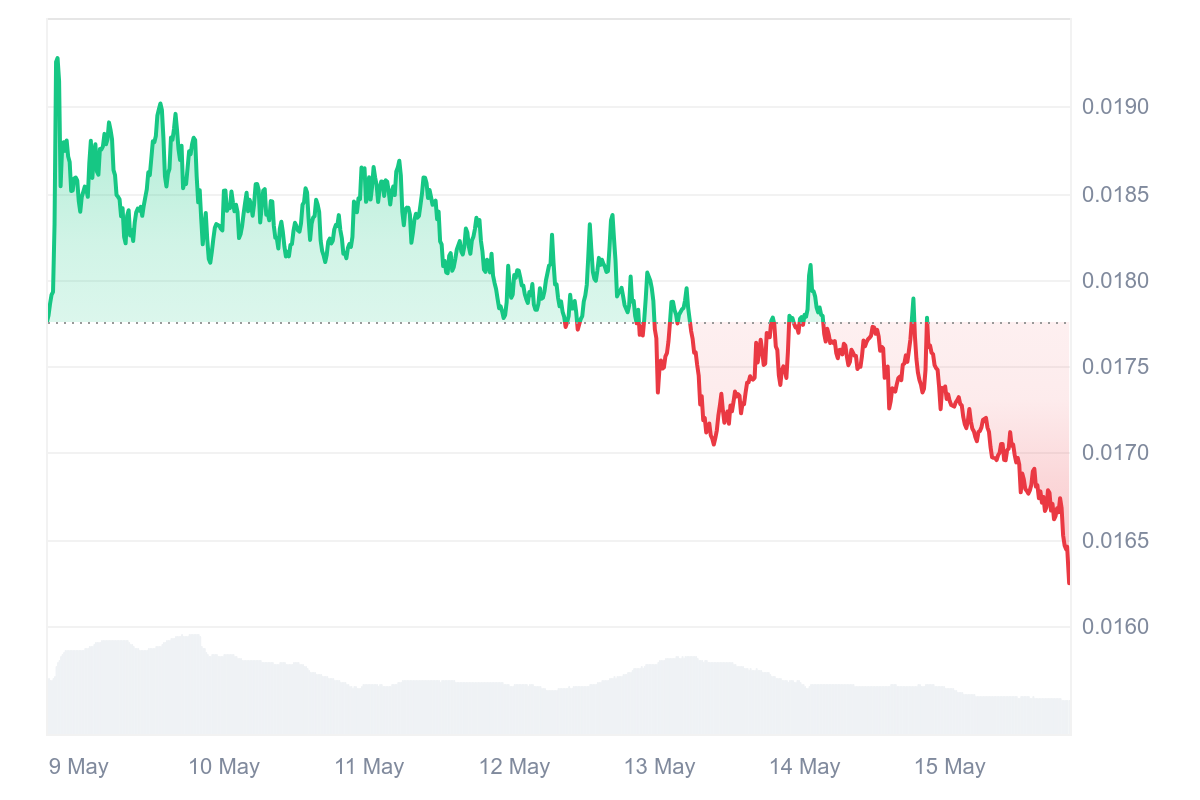
Source: CoinMarketCap
XCN Price Struggles and Eyes $0.01750 Resistance
A prominent crypto analyst, GemXBT, highlighted that Chain (XCN) continues to trade under bearish pressure, and the price is now firmly below the 5, 10, and 20-period moving averages. This short-term moving average formation below the current price is a classic bearish momentum indicator, and it indicates that the sellers are still in charge.
This technical weakness indicates that XCN cannot assemble significant buy-side demand, and every effort at bouncing back continually got cold feet. The trend situation remains weak, and it is challenging for the asset to make any big bounce back in the short term.
In addition to this bearish attitude, bearish convergence is shown by the MACD (Moving Average Convergence Divergence) indicator. This, which is shown by the MACD line, is an indicator that bearish momentum is not only ongoing but also gaining strength.

Source: X
But all the signs are not heading in the same direction. The Relative Strength Index (RSI) is headed for oversold territory and has served as an indicator for a reverse or a bounce. The closest support to the target is NEAR $0.01600, which can be a make-or-break level if investors return to be buyers.
On the other hand, resistance to the upside is $0.01750, a level that must be breached to challenge the dominant downtrend. Although the larger perspective is bearish, the setup suggests that a relief bounce can be anticipated if support at the key level is maintained and momentum begins to shift.
Related Reading: From $150 to $300? Solana’s Roadmap to a Major Breakout
