Celestia (TIA) Breaks Out: Can It Defy Gravity and Hit $9?

TIA’s price rockets upward—fueled by modular blockchain hype and trader FOMO. But can it sustain the momentum?
Technical indicators scream bullish: rising volume, key resistance shattered. Yet skeptics whisper ’overbought’—another crypto pump waiting for a dump?
Wall Street’s watching. Mainstreet’s buying. The real question: Will TIA become the next SOL... or just another bagholder trap?

- Celestia (TIA) shows signs of a bullish breakout, recovering from key support levels, signaling potential upside.
- A break above TIA’s descending channel midline could trigger a bullish move toward resistance at $4.50 and beyond.
- Key resistance levels at $9.24, $13.16, and $17.73 are vital targets for TIA’s bullish continuation in the long term.
Celestia (TIA) is gaining massive interest in the crypto scene, showing signs that may indicate a potential bullish breakout. TIA has shown a recent recovery at a critical level of support; indicating a possible change of direction in its price movement. Rose Premium Signals mentioned that a break above its descending channel’s midline could significantly rise Celestia. The next few weeks will be vital when determining cryptocurrency’s future.
Celestia Potential Bullish Breakout
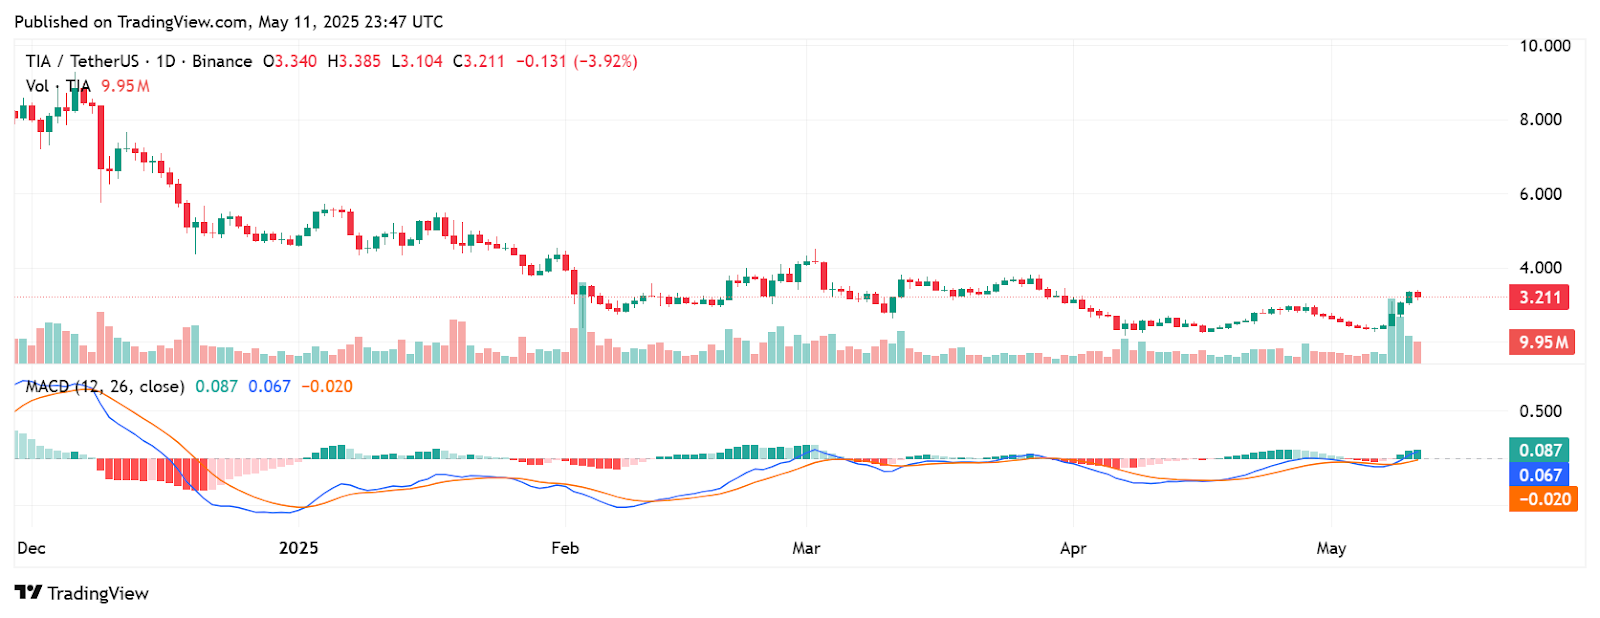
The cryptocurrency is currently testing support in the proximity to the lower boundary of the historic prices. Should prices retreat from this zone, it may cause a significant move up. According to the analysis, a break above the midline may induce strong bullish activity thus directing the price to the $4.50, $6.50, and $9.00 resistance. Traders should follow these price levels for important cues in the short run.
Source: X
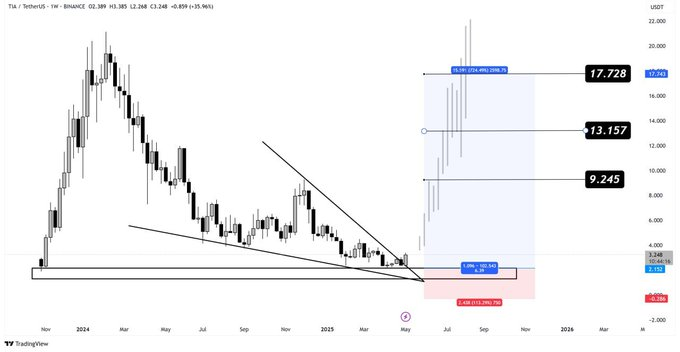
Analysis of the one-week chart shows the existence of even stronger bullish potential for Celestia. The expected main resistance levels are at $9.24, $13.16 and $17.73, as the price rises. If this momentum holds then TIA could break out of its persistent negative trend, a trend that has been in place for months.
Key Resistance Barriers
It is important for investors to verify the breakout. If the upward trend continues, achieving midline might rocket the price to $9. Breaking over the $9 level would be the first barrier to be broken through for the rise to $13.16 and $17.73. Breaking through each of the resistances might be an additional point in the bullish movement’s development. As of press time, Celestia is trading at $3.21, showing a 35% increase over the past week.
Source: TradingView
Without constant market volatility, traders need to be on look out for indications that a breakout might be sustained. If upward momentum loses its ground, there is a possibility of the consolidation continuing or the price of decline. It is imperative for the traders’ keenly monitor price movements in order to establish whether the bullish excitement continues or a change to bearishness is eminent.
As Celestia seems to be positive, whether this breakout happens or not remains to be seen in time. In addition, investors need to pay attention to crucial signals that are likely to propel price increments. Should Celestia hold the breakout well, it might see significant profit, but it is wise to remain vigilant.