Ethereum Demand Explodes 65.5x Since 2020 – Why Analysts Are Betting Big on 2026

Ethereum's demand curve just went parabolic. The network now handles 65.5 times more activity than it did in 2020 – and institutional money is finally waking up to the potential.
What's driving the surge? Three words: DeFi, NFTs, and institutional FOMO. While Wall Street was busy shorting crypto in 2022, builders kept shipping. Now the smart money's playing catch-up.
2026 price targets are getting aggressive. Some analysts see ETH's current valuation as the discount of the decade – though as always in crypto, take those predictions with a grain of salt and a shot of tequila.
Bottom line? The network effect is real. Whether this is the start of Web3's iPhone moment or just another hype cycle remains to be seen – but the on-chain numbers don't lie.

New on-chain data shared by Milk Road shows how Ethereum’s real demand has expanded far quicker than its valuation over the last four years. The numbers highlight a major change in how users handle money on the network. Since 2020, the supply of stablecoins sitting on ethereum has climbed by 65.5x.
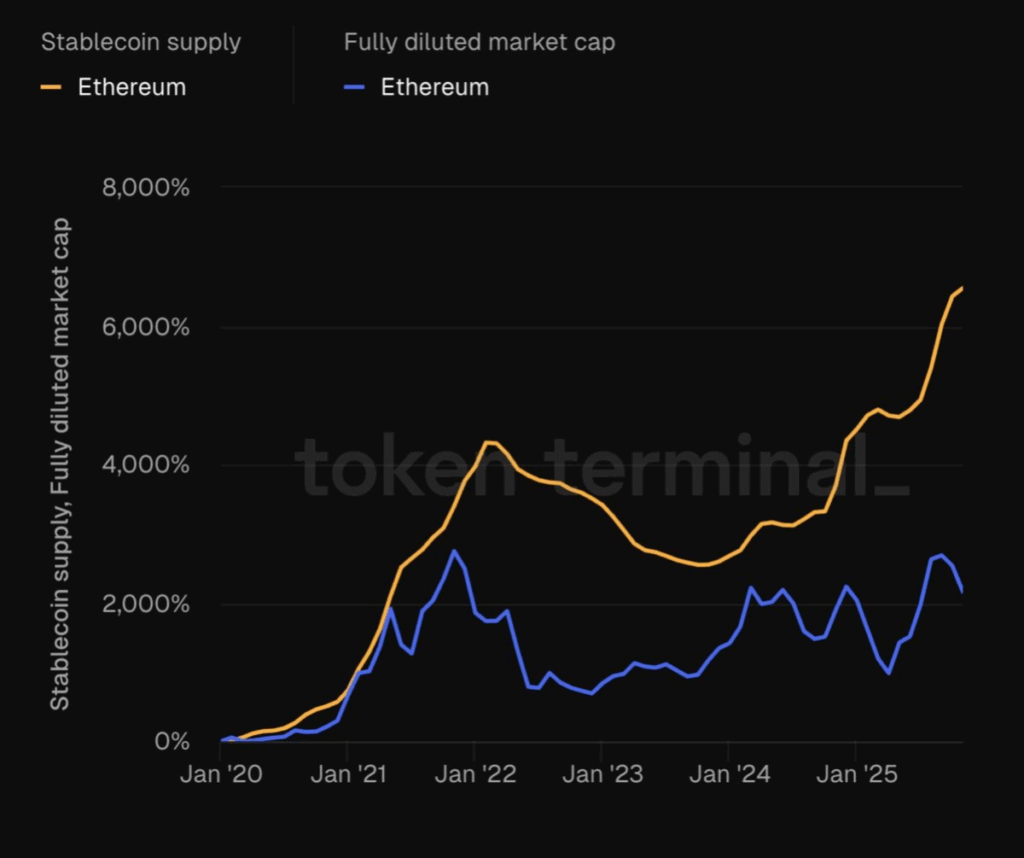
This kind of rise signals active usage, because stablecoins usually MOVE where real economic activity is building. During the same period, Ethereum’s fully diluted market cap grew by 21.6x. The gap between these two lines shows how the chain’s economic foundation has scaled much faster than its price.
Market watchers often look at such spreads as early signs of longer-term value alignment. If Ethereum’s price eventually adjusts to match the pace of its activity growth, the difference between the two curves may narrow in the coming cycles.
Analysts Point to a Slow Phase Before a Larger Upside Window
Analyst EliZ shared that Ethereum’s chart currently sits among the weaker setups in the market, yet he believes this slow period is preparing the ground for a stronger cycle.
He noted that the ETH/BTC pair is consolidating on key support and still needs one final downward move to clear remaining liquidity. This type of structure usually forms during lengthy and uneventful phases that often appear before stronger market rotations.
As for $ETH, it's true: at the moment, it looks like one of the worst charts in the industry.
But I've said it many times before: the interesting part for ETH and altcoins is not now ….it will happen between the end of Q4 and, above all, Q1 2026.
The reason is simple.
The…
EliZ also pointed to the broader macro backdrop. Quantitative tightening is expected to end in December, and even a mild shift toward quantitative easing in the months after could push liquidity back toward risk assets. He highlighted the near-empty Reverse Repo Facility, which signals that the Federal Reserve is no longer absorbing liquidity.
When this happens, more capital tends to flow into markets, and altcoins such as ETH usually react strongly. He maintained that Ethereum’s major moment is not now but is more likely to FORM heading into Q1 2026.
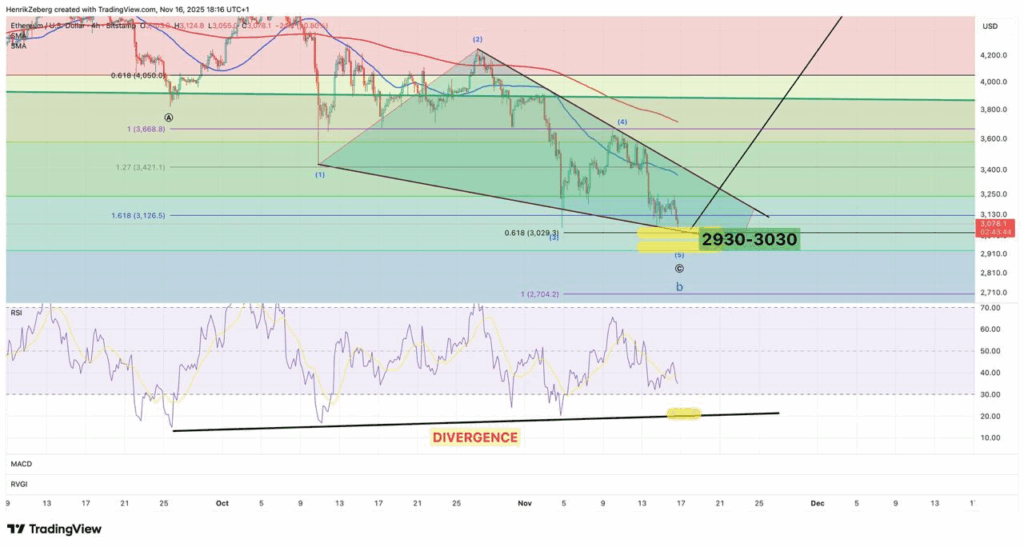
Ethereum Trades in a Key Demand Zone as Reversal Signals Build
Ethereum is trading at $3,065.86, holding above an important zone that has supported buyers in the past. Analyst Marzell pointed out that ETH recently tapped the $2,930–$3,030 demand area, which also aligns with bullish RSI divergence and the completion of a final wave pattern. He listed $3,180 as the first trigger level, followed by $3,350 for a breakout, and potential targets at $3,600, $3,820, and $4,050.