Michael Saylor’s Bold Claim: Bitcoin to Eclipse Gold’s Market Cap by 2035

Bitcoin’s bull run isn’t slowing down—and MicroStrategy’s Michael Saylor just doubled down. The crypto evangelist predicts BTC will overtake gold’s market cap within a decade, leaving the 'ancient relic' in the dust.
Why the confidence? Scarcity meets utility. While gold hoarders cling to vaults, Bitcoin’s programmable scarcity and institutional adoption are rewriting the rules. Even Wall Street’s goldbugs are sweating.
Of course, gold’s $12T market cap won’t vanish overnight. But with BlackRock’s ETFs and nation-state accumulation fueling Bitcoin’s rise, the flippening looks inevitable. Just don’t tell the Fed.
*Cynical finance jab*: Meanwhile, gold ETFs still charge 0.4% fees for the privilege of storing a shiny paperweight.

Bitcoin advocates received a bold forecast this week as Michael Saylor stated that he expects BTC to surpass gold’s market capitalization by 2035.
Saylor highlighted that 2035 marks the year when 99% of BTC will have been mined, emphasizing the finite supply and digital scarcity of the asset. According to Saylor, anyone aiming to acquire Bitcoin should act before the final 1% is mined over the following century.
The prediction has sparked widespread discussion in the crypto community. Analysts point to Bitcoin’s unique characteristics as key differentiators from gold.
While gold is a static and physical asset, bitcoin is programmable, globally transferable, and operates on a decentralized network, allowing for rapid adoption as a store of value. Social media commentators describe Saylor’s prediction as ambitious yet plausible, citing the long-term potential of digital scarcity and secure value storage.

Current Bitcoin Market Outlook
Bitcoin is trading at $99,254, down by 5.14% in the past week. Bitcoin’s recent break below its 20-week Exponential Moving Average (EMA) of $109,670 is being tested at support levels close to the 50-week EMA of $100,937.
According to a technical analysis, below this level, a strong close may see further selling, testing the 100-week EMA at $85,462. For longer-term perspectives, support lies at the 200-week EMA of $66,924, which has always marked a low during bear phases.
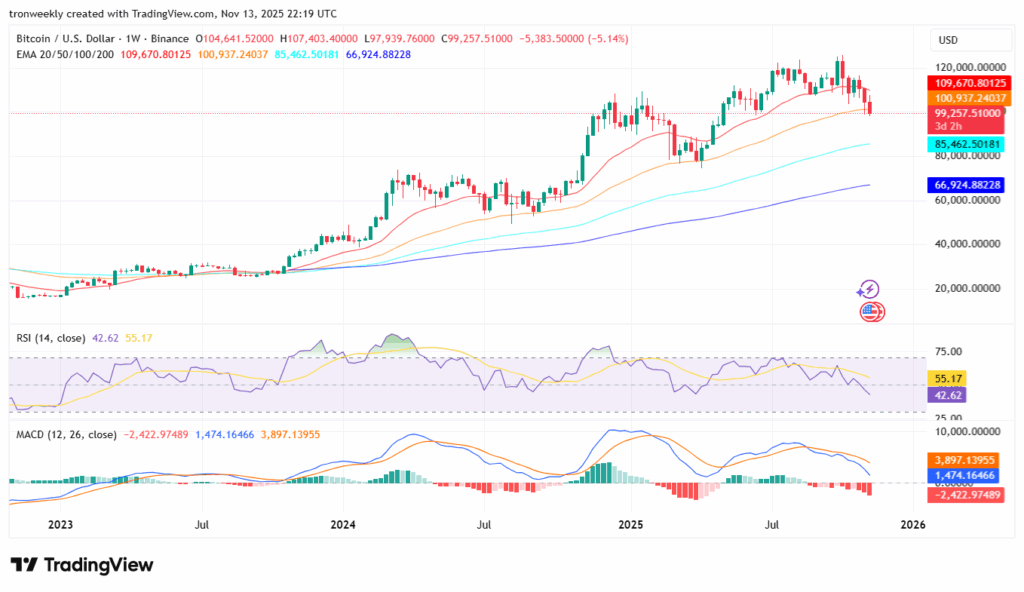
Indicators of momentum support this advice to be cautious. The Relative Strength Index (RSI) is down at 42.62, indicating slowing purchase momentum.
The Moving Average Convergence/Divergence (MACD) is also negative, as both lines have moved below zero, pointing to strong selling pressure. That said, Bitcoin is merely going through a correction cycle in the bigger picture of strong purchase momentum.
Bitcoin Mirrors 2019 Market Conditions
According to analysts, BTC’s present scenario is more similar to conditions in 2019 as compared to those in 2021, for reasons including interest rate cuts and an end to quantitative tightening.
Market sentiment is somewhat subdued, but at least there is no hint of the kind of euphoria observed at cycle highs in previous cycles. Correlation studies between Gold and BTC, as well as historical analysis, suggest that rallies for BTC are possible in the coming months.
I still think Bitcoin top isn't in.
Here’s why:
No euphoria➨ People keep saying that we are in a 4-year cycle, but there was no euphoria at the top. People were 100x more euphoric in December 2024 than now.
Gold-BTC correlation➨ Gold has cooled off after a rally. BTC has…
Traders’ eyes remain set on the $105,000 to $110,000 level for a possible bounce. Consistent trading above the 50-week EMA WOULD signify that the asset is in a state of consolidation, which is a
On the other hand, a fall below $99,000 may accelerate bear dominance, which might lead to a drop to $85,000 to $87,000 levels in the short run, depending upon volume analysis and RSI recovery levels.
