Ethereum November 2025: Is a Massive Breakout Imminent?

Ethereum's charts are flashing signals that could make even the most jaded trader sit up. With November 2025 looming, the smart contract giant looks primed for a volatility surge—will it be a moonshot or a rug pull?
Technical indicators whisper 'bullish.'
Liquidity pools are tightening, derivatives open interest is spiking, and the whispers of 'ETH 2.0 final upgrade' are getting louder. Meanwhile, legacy finance bros still think it’s a 'tech stock.'
Buckle up.

- November 2025 is expected to close with an average of $3,749.51, showing a steady growth in ETH.
- Ichimoku & ADX signal strength weakening momentum for ETH.
- Ethereum (ETH) currently has a market capitalization of approximately $396.46 billion.
Ethereum (ETH) is currently the second-largest cryptocurrency by market capitalization. Traders and analysts alike are increasingly bullish on it for November 2025. Indeed, Ethereum (ETH) investors are closely watching to see whether ETH is positioning for a possible breakout this month, supported by rising network activity, improving market sentiment, and several confirming technical indicators.
Ethereum’s (ETH) November Forecast
According to Coincodex’s current price prediction for ethereum (ETH), the price is expected to rise by 11.70% and reach $ 3,803.89 by December 06, 2025. Based on the ETH forecast, it’s now a good time to buy the altcoin.

As per Coincodex data, over the next five days, ETH will reach the highest price of $ 3,757.08 on November 11, 2025, which WOULD represent 14.00% growth compared to the current price.

November 2025 is expected to close with an average of $3,749.51, showing a steady growth in ETH. December is predicted to have an average of $4,163.31 with a 56.40% increase. This indicates a continuous bullish momentum for the altcoin
In 2025, Ethereum (ETH) is expected to exchange hands in a trading range of $3,405.37 and $ 5,158.36, resulting in an average annualized price of $ 3,956.41. This could result in a potential return on investment of 56.40% compared to the current rates.
ETH’s Trend Remains Bearish as Momentum Strengthens
The Ichimoku Cloud of Ethereum (ETH) signals a bearish trend and weak market structure. ETH remains in a strong bearish zone as long as it stays under the cloud. No bullish reversal signals yet.
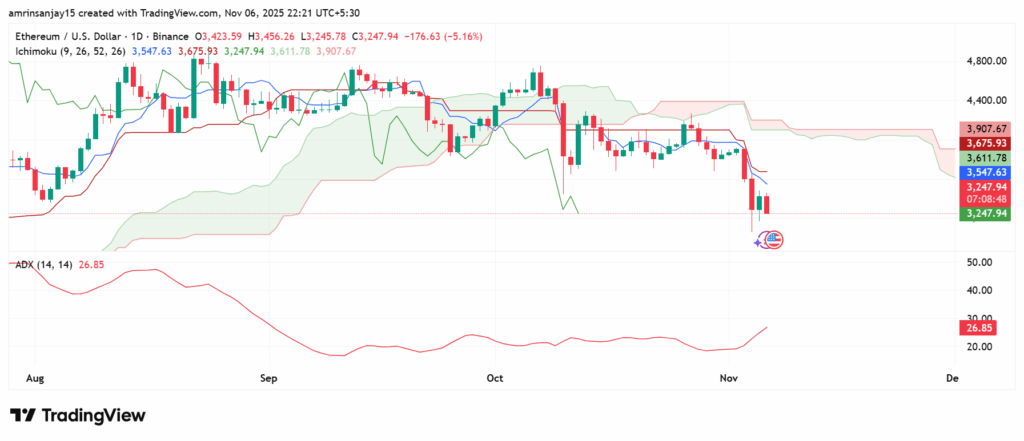
ETH’s Average Directional Index (ADX) is around 26.85, which indicates a moderately strong trend. ADX supports the view that ETH’s downward trend is strengthening rather than weakening.
Trend Insights, Crucial Support and Resistance Levels
Ethereum (ETH) currently has a market capitalization of approximately $396.46 billion, with a trading volume of about $37.12 billion in the last 24 hours. At press time, the altcoin is trading at $3,272.6, having decreased by 4.11% over the past 24 hours.
The price is moving in a bearish trend and is currently testing a resistance level NEAR $3,424.03. If it breaks above this, the next target could be $3,600.00. On the downside, the support level is around $3,290.43. If the altcoin falls below this level, we might see a drop towards $3,200.00.
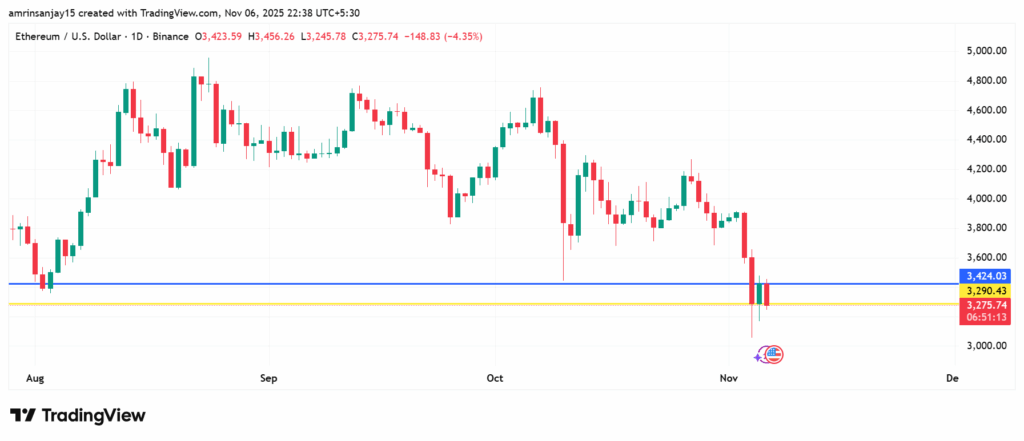
The blue line indicates the resistance level at $3,424.03, while the yellow line represents the support level at $3,290.43.
With CoinCodex projecting ETH to close November 2025 at an average of $3,749.51, the outlook points toward steady long-term growth. Despite current bearish signals, this forecast suggests ETH may regain momentum over time, aligning with broader recovery expectations in the market.
