Chainlink (LINK) Consolidation Phase: 3 Critical Indicators That Will Dictate Its Next Major Price Movement

Chainlink's consolidation pattern tightens as traders watch for the breakout signal.
Technical Analysis Breakdown
The oracle network's native token has been trading in a narrowing range for weeks, creating what technical analysts call a 'coiling spring' pattern. Three key metrics are flashing amber: trading volume has dropped 42% from last month's average, the RSI sits at a neutral 54, and the 50-day moving average is converging with current price levels.
Market Sentiment Indicators
Whale accumulation patterns show large wallets adding another 3.7 million LINK during this consolidation phase. Meanwhile, the funding rate across major exchanges remains slightly positive—suggesting cautious optimism among leveraged traders. The options market tells a different story though, with put-call ratios indicating some hedging activity.
On-Chain Metrics Matter
Network activity continues to impress with 571 new integrations this quarter alone. Total value secured by Chainlink oracles now exceeds $3 billion across DeFi protocols. Yet LINK's price action remains disconnected from these fundamentals—typical in crypto where price discovery sometimes feels more like gambling than investing.
The breakout direction will likely determine LINK's trajectory for the remainder of 2025.

- RSI near mid-range shows balanced market sentiment for Chainlink (LINK).
- MACD line below signal indicates fading momentum.
- EMA 200 at $20.66 acts as major resistance, keeping the trend under pressure.
Chainlink (LINK), the top decentralized oracle network, is consolidating now as market conditions become less volatile and traders look for a clear directional move. With technicals and on-chain metrics in alignment, investors are keeping close tabs on three key indicators that can determine LINK’s next significant price direction.
RSI, MACD & EMA 200: Chainlink’s (LINK) 3 Technical Indicators to Watch
The Relative Strength Index (RSI) of chainlink (LINK) indicates a normal buying and selling activity in the altcoins network, as the median is shown between 60 and 30. The RSI values of 46.35 and 40.07 indicate neutral market conditions, suggesting normal buying and selling activity.
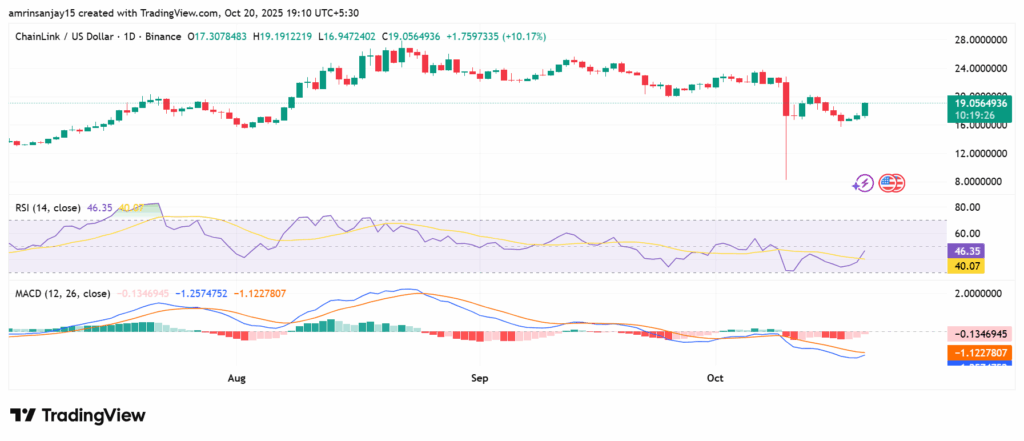
The Moving Average Convergence Divergence (MACD) of LINK, indicates a bearish crossover, suggesting that the price may decrease temporarily. The signal line above the MACD line indicates a bearish crossover. The blue line represents the MACD line, while the orange line indicates the signal line.
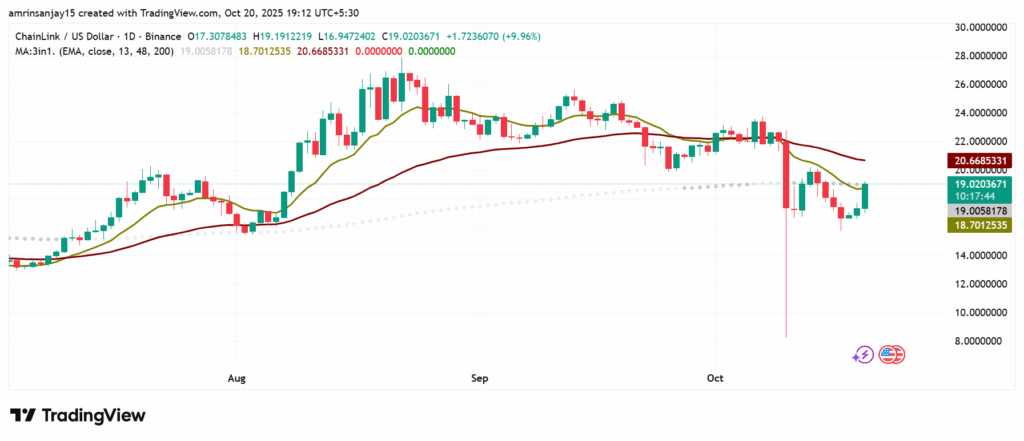
The altcoin is still bearish under the EMA 200 ($20.66), but the shorter EMAs rising closer to $18.70-$19.00 suggest bullish momentum is gradually returning. A breakout and continued move above $20.66 WOULD be an affirmation of a trend reversal to a more positive outlook.
Analyzing LINK’s Trend with Key Resistance and Support Levels
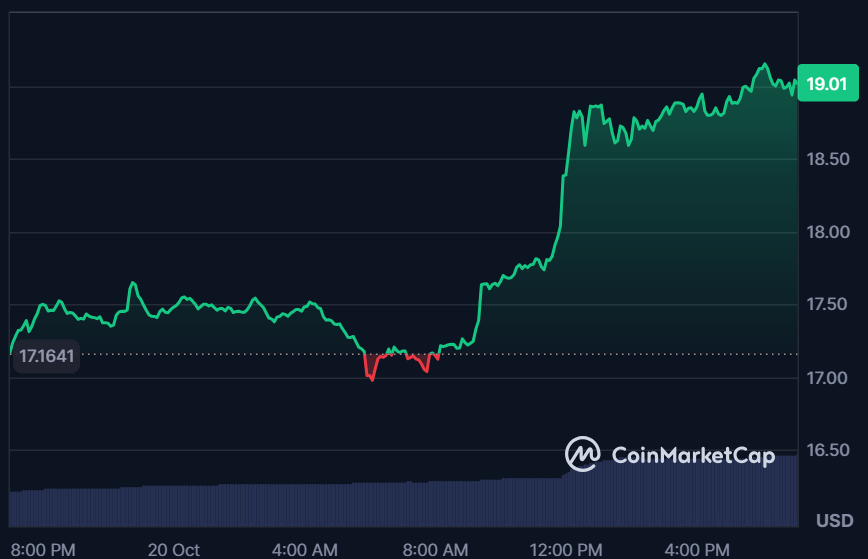
LINK currently has a market capitalization of approximately $12.88 billion, ranking it in the top alternative coins, with a trading volume of about $1.13 billion in the last 24 hours. At press time, the altcoin is trading at $19.01, having increased by 9.75% over the last 24 hours.
The price is moving in a bullish trend and is currently testing a resistance level NEAR $17.30. If it breaks above this, the next target could be $18.00. On the downside, the support level is around $16.58. If the altcoin falls below this level, we might see a drop towards $14.00.
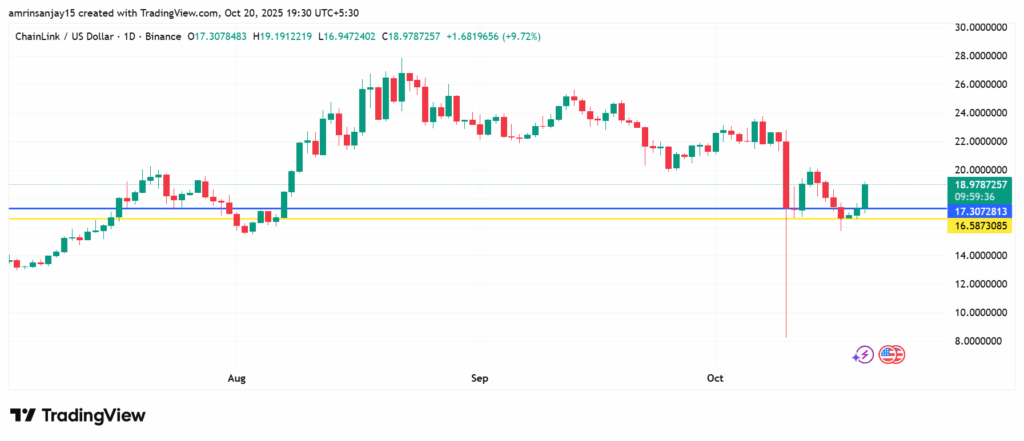
The blue line indicates the resistance level at $17.30, while the yellow line represents the support level at $16.58.
Conclusion
Chainlink’s (LINK) current setup suggest a phase of uncertainty ,with the RSI showing neither bullish nor bearish sentiment and the MACD showing bearish lean, hinting at dissipating momentum. The EMA 200 at $20.66 is still the critical level to monitor, a rejection there could confirm short-term weakness, while a breakout above it may mark the initiation of a new uptrend.
