Bitcoin’s $150K Dream: The Single Resistance Level Blocking Its Path (Analyst Reveals)

Bitcoin bulls keep charging—but one stubborn resistance level stands between BTC and the $150,000 promised land.
Here’s what’s holding it back.
### The Wall Bitcoin Can’t Crack (Yet)
Analysts pinpointed the exact price zone where sellers keep dumping like it’s 2021. Until BTC smashes through, six figures remain a mirage.
### Liquidity Hunters vs. Diamond Hands
Whales are stacking, retail’s FOMO-ing, and yet—the order books scream 'not so fast.' Classic crypto: everyone wants lambos until the charts flash red.
### When ‘Up Only’ Meets Reality
Sure, institutions are nibbling. Yes, the halving’s in the rearview. But markets love to humble the overconfident—just ask the '100K by EOY 2024' crowd.
Break this level? Moon. Fail? Strap in for another round of 'macro headwinds' and 'reevaluations.' Such is life at the edge of financial innovation—where hopium and hard resistance collide.
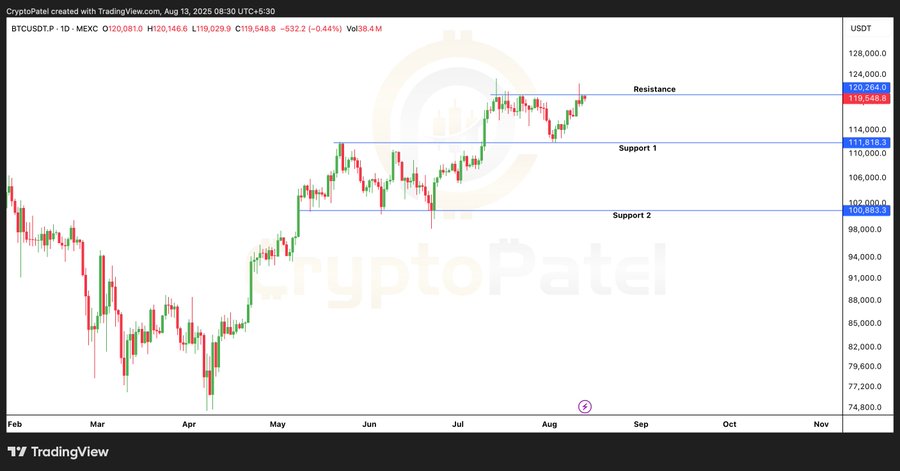 Crypto Patel bullish on BitcoinBitcoin 1D Chart | Crypto Patel
Notably, Bitcoin recorded an all-time high of $123,000 on July 14 after recovering from a major move below $100,000 in June. However, following the resistance at $123K, BTC declined to $111,943 on August 3 before settling at its current price. The $120K zone has now capped price advances since late July. Multiple daily candles have touched or neared the level between July and August without closing above it.
As of this press, Bitcoin is trading at $119,932, a 1% gain in the past day, increasing its weekly run to 5.1%. From the daily chart shared by the analyst, Bitcoin reached a high of $120,146.6, falling just short of the marked resistance at $120,264.
Other Analysts Predict Next Bitcoin Move
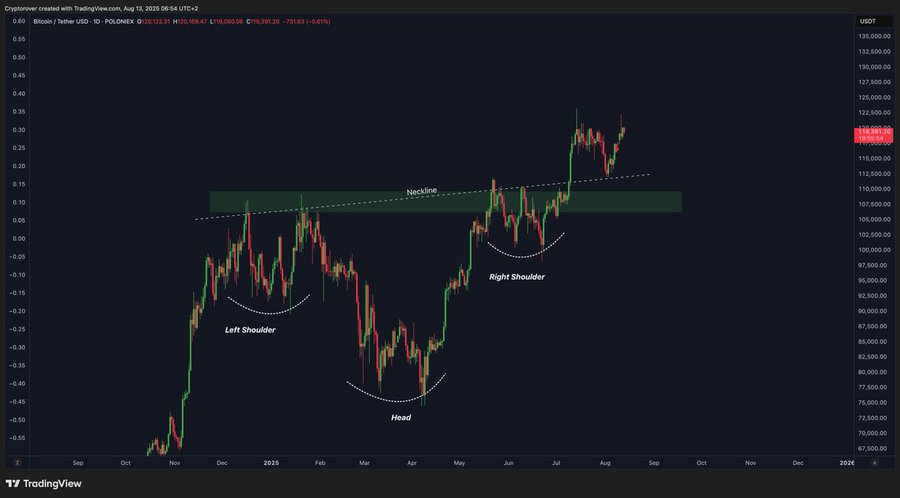
Meanwhile, a chart shared by crypto expert Crypto Rover shows Bitcoin is flashing a strong bullish signal after completing and confirming an inverse head and shoulders pattern on the daily chart, with the neckline in the $110,000–$113,000 range now acting as key support.
Crypto Patel bullish on BitcoinBitcoin 1D Chart | Crypto Patel
Notably, Bitcoin recorded an all-time high of $123,000 on July 14 after recovering from a major move below $100,000 in June. However, following the resistance at $123K, BTC declined to $111,943 on August 3 before settling at its current price. The $120K zone has now capped price advances since late July. Multiple daily candles have touched or neared the level between July and August without closing above it.
As of this press, Bitcoin is trading at $119,932, a 1% gain in the past day, increasing its weekly run to 5.1%. From the daily chart shared by the analyst, Bitcoin reached a high of $120,146.6, falling just short of the marked resistance at $120,264.
Other Analysts Predict Next Bitcoin Move
Meanwhile, a chart shared by crypto expert Crypto Rover shows Bitcoin is flashing a strong bullish signal after completing and confirming an inverse head and shoulders pattern on the daily chart, with the neckline in the $110,000–$113,000 range now acting as key support.