BTCC
/
BTCC Square
/
Thecryptobasic
/
🚀 Dogecoin Smashes Resistance: Analysts Eye Explosive Rally Ahead
🚀 Dogecoin Smashes Resistance: Analysts Eye Explosive Rally Ahead

7
1
Dogecoin just bulldozed through critical resistance levels—and crypto traders are scrambling for position. Here’s why the meme coin might be gearing up for a wild ride.
The breakout play: DOGE’s surge past key technical barriers signals potential momentum buildup. No guarantees, but charts hint at a classic ‘hold on tight’ scenario.
Market irony alert: A joke-turned-juggernaut now moves markets while Wall Street still debates if crypto is ‘real.’ Meanwhile, retail investors keep printing life-changing gains with dog memes.
Could this be the start of DOGE’s next parabolic move? Or just another fakeout before the Fed ruins the party? Either way—buckle up.
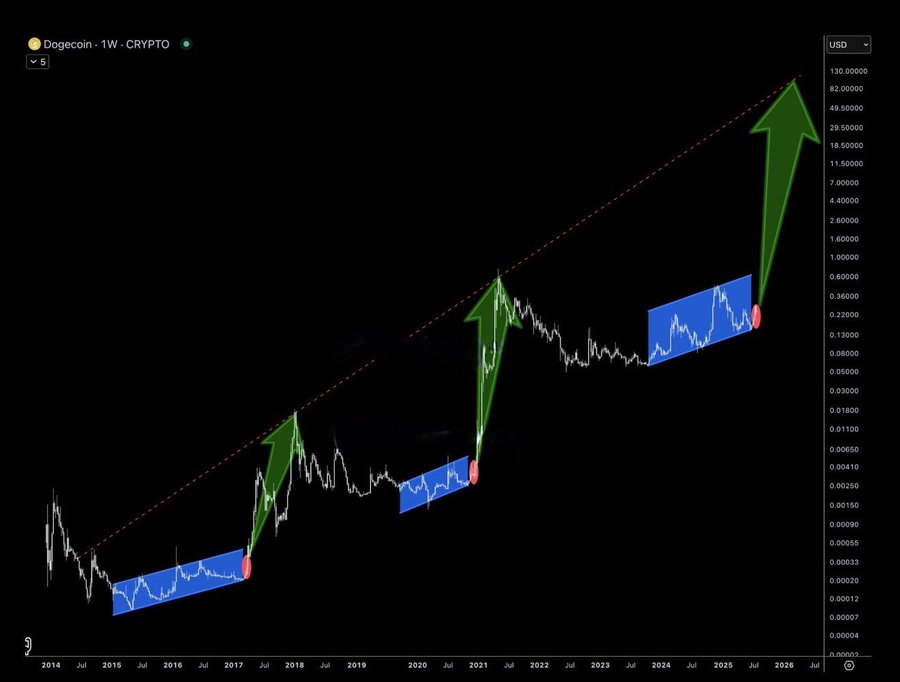 The first zone spans 2015 to 2017, where dogecoin price ranged between $0.00012 and $0.00035 before moving sharply higher. The second covers mid-2019 to late 2020, with a price range of $0.0015 to $0.005.
That breakout eventually led to Dogecoin’s all-time high of $0.7316. Meanwhile, from 2022 to 2025, the current consolidation has held within $0.055 to $0.22. The recent move above $0.22 is now seen as a potential early-stage breakout.
Dogecoin is trading at $0.2216, a 4.1% decrease in the past day, increasing the weekly loss to 15.4%. However, the memecoin still maintains a 34% surge in the past month, coinciding with the broader market move.
Double Bottom Breakout Signals Momentum Shift
Meanwhile, the chart also illustrates a double bottom pattern inside the most recent accumulation range. This pattern forms when a price hits a similar low twice before reversing direction. It is often interpreted as a sign of buying strength and trend reversal, particularly when accompanied by increased volume.
Asghar marked the $0.22 level as a breakout point. If Dogecoin holds above this threshold on a retest, the level may become solid support and confirm a possible shift toward a bullish trend. Notably, similar setups in the past have resulted in steep gains.
Analyst Predicts 226% Dogecoin Price Surge
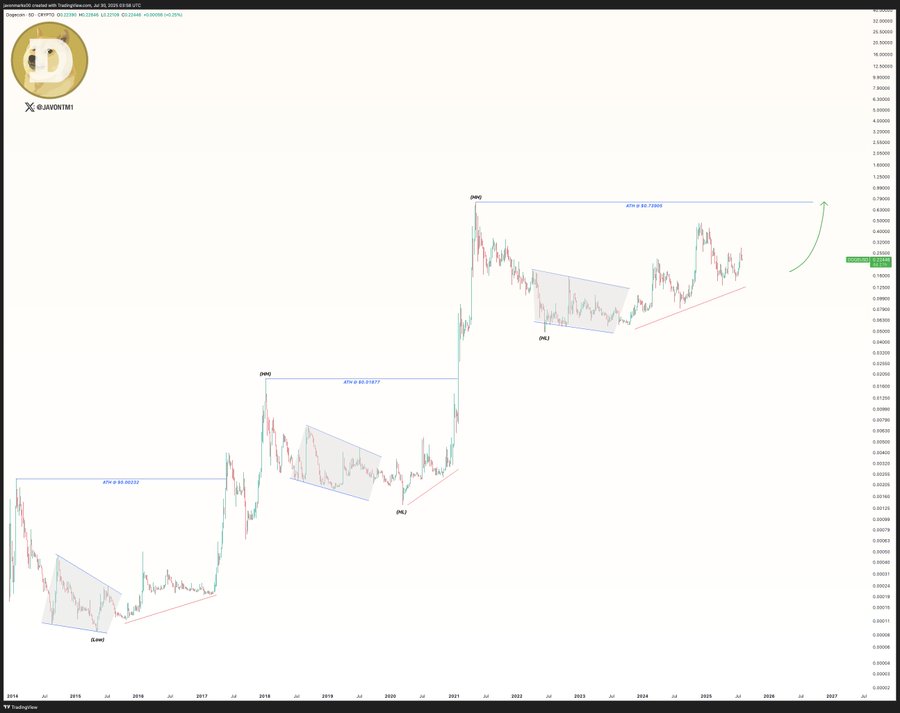
According to a similar chart by trader Javon Marks, Dogecoin price may be preparing for a significant price move. The analysis highlights a recurring pattern of accumulation followed by breakout phases, similar to previous bull runs.
The first zone spans 2015 to 2017, where dogecoin price ranged between $0.00012 and $0.00035 before moving sharply higher. The second covers mid-2019 to late 2020, with a price range of $0.0015 to $0.005.
That breakout eventually led to Dogecoin’s all-time high of $0.7316. Meanwhile, from 2022 to 2025, the current consolidation has held within $0.055 to $0.22. The recent move above $0.22 is now seen as a potential early-stage breakout.
Dogecoin is trading at $0.2216, a 4.1% decrease in the past day, increasing the weekly loss to 15.4%. However, the memecoin still maintains a 34% surge in the past month, coinciding with the broader market move.
Double Bottom Breakout Signals Momentum Shift
Meanwhile, the chart also illustrates a double bottom pattern inside the most recent accumulation range. This pattern forms when a price hits a similar low twice before reversing direction. It is often interpreted as a sign of buying strength and trend reversal, particularly when accompanied by increased volume.
Asghar marked the $0.22 level as a breakout point. If Dogecoin holds above this threshold on a retest, the level may become solid support and confirm a possible shift toward a bullish trend. Notably, similar setups in the past have resulted in steep gains.
Analyst Predicts 226% Dogecoin Price Surge
According to a similar chart by trader Javon Marks, Dogecoin price may be preparing for a significant price move. The analysis highlights a recurring pattern of accumulation followed by breakout phases, similar to previous bull runs.
By:
Previous
Crypto Expert Reveals: Holding Just 1,000 XRP Puts You Miles Ahead of the Pack
Next
White House Crypto Report Snubs Bitcoin Reserve—Here’s the Shocking Focus Instead
