XRP Primed for Double-Digit Surge if Symmetrical Triangle Breakout Holds—Here’s the Math

XRP traders are eyeing a potential moonshot as the cryptocurrency teeters on the edge of a decisive technical breakout.
Symmetrical triangle patterns don't lie—until they do. But if this one plays out, the math suggests XRP could be gearing up for a double-digit price explosion.
The Setup: A Textbook Technical Play
Classic chart patterns still move crypto markets—despite what decentralized finance maximalists claim. The symmetrical triangle tightening around XRP’s price action signals an imminent volatility spike.
The Target: Simple Geometry, Big Implications
Measure the triangle’s height at its widest point, then project that distance from the breakout level. The result? A price target that could send shockwaves through the ‘utility token’ narrative.
The Caveat: This Is Crypto, After All
Breakouts fail. Liquidity gaps appear. And let’s be honest—half the traders chasing this pattern couldn’t explain ‘symmetrical’ if their leveraged positions depended on it. But when the chart aligns, even the skeptics watch the order book.
Will this be the move that finally justifies XRP’s market cap? The chart says maybe. The math says how much. And the crypto markets? They’ll say whatever pumps it hardest.
 XRP Symmetrical Triangle | EGRAG Crypto
Amid these attempts, market participants have grown increasingly anxious, especially during times of extreme bearish pressure like what the crypto market witnessed over the weekend.
XRP Breakout Timeline
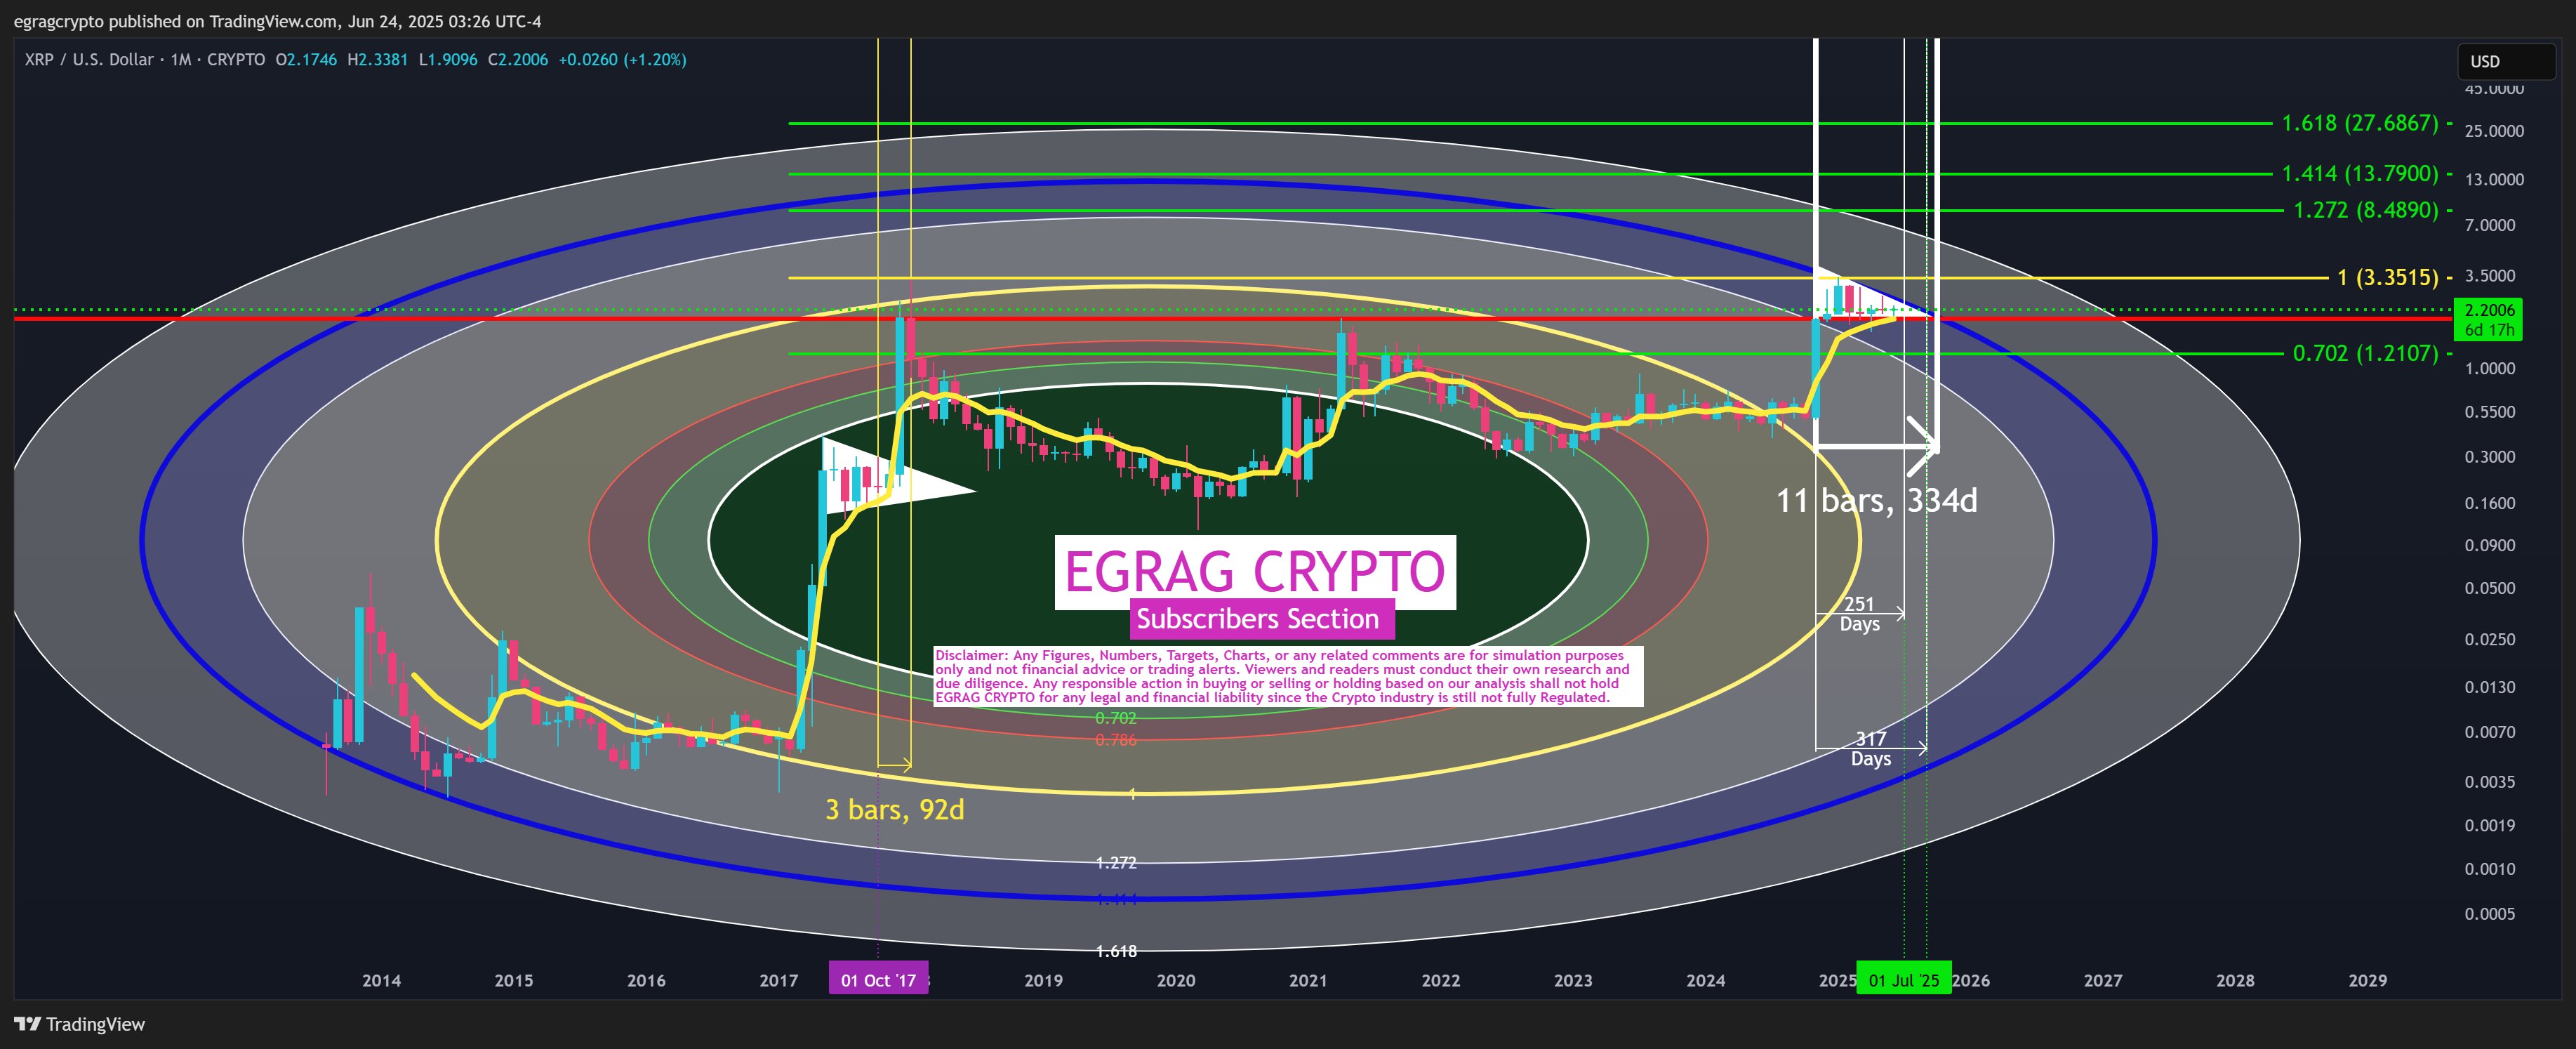
In an effort to ascertain when a successful breakout will occur, EGRAG leveraged historical data. According to him, breakouts from such triangle formations often happen 75% to 95% of the duration of the entire structure. The analyst presented this theory with a total duration of 334 days, essentially 11 weeks.
Since Q4 2024, XRP has already spent over 200 days in this symmetrical triangle. As a result, EGRAG suggests that a breakout could occur in early July, representing 251 days or 75% of the total 334-day duration. If this doesn't materialize, he expects the breakout to happen between early July and mid-September, marking 317 days or 95% of the total 334-day duration.
After the expected breakout, EGRAG believes XRP will likely be on track for new price heights. Data from the chart shows that his first target is the $3.35 high, representing Fibonacci 1. From here, EGRAG sees XRP reaching several Fibonacci extensions, with the second target resting at $8.49, around the Fib. 1.272 extension. This would mark a new all-time high.
Meanwhile, the market analyst expects further upside, suggesting XRP could rally to a new peak of $13.79 at Fibonacci 1.414. After this, EGRAG believes XRP has the potential to claim a price of $27.68, aligning with Fib. 1.618. Notably, from the current price of $2.17, XRP must rally from 291% to 1,175% to reach the $8 to $27 price region.
XRP Symmetrical Triangle | EGRAG Crypto
Amid these attempts, market participants have grown increasingly anxious, especially during times of extreme bearish pressure like what the crypto market witnessed over the weekend.
XRP Breakout Timeline
In an effort to ascertain when a successful breakout will occur, EGRAG leveraged historical data. According to him, breakouts from such triangle formations often happen 75% to 95% of the duration of the entire structure. The analyst presented this theory with a total duration of 334 days, essentially 11 weeks.
Since Q4 2024, XRP has already spent over 200 days in this symmetrical triangle. As a result, EGRAG suggests that a breakout could occur in early July, representing 251 days or 75% of the total 334-day duration. If this doesn't materialize, he expects the breakout to happen between early July and mid-September, marking 317 days or 95% of the total 334-day duration.
After the expected breakout, EGRAG believes XRP will likely be on track for new price heights. Data from the chart shows that his first target is the $3.35 high, representing Fibonacci 1. From here, EGRAG sees XRP reaching several Fibonacci extensions, with the second target resting at $8.49, around the Fib. 1.272 extension. This would mark a new all-time high.
Meanwhile, the market analyst expects further upside, suggesting XRP could rally to a new peak of $13.79 at Fibonacci 1.414. After this, EGRAG believes XRP has the potential to claim a price of $27.68, aligning with Fib. 1.618. Notably, from the current price of $2.17, XRP must rally from 291% to 1,175% to reach the $8 to $27 price region.
