BTCC
/
BTCC Square
/
Thecryptobasic
/
Solana Stumbles to $163—Is the Bearish Tide Pulling It Toward $150?
Solana Stumbles to $163—Is the Bearish Tide Pulling It Toward $150?

6
1
Solana’s price takes a hit as bearish patterns dominate—traders brace for a potential slide to $150.
Another day, another crypto correction. Solana joins the club with a dip to $163, sparking fears of further downside. Technicals suggest the $150 level could be next unless bulls step in. But let’s be real—when has the market ever followed the script?
Pro tip: Wall Street ’analysts’ will now flip-flop between ’buy the dip’ and ’impending doom’ every 24 hours. Stay sharp.
 Solana Price Chart
With three consecutive bearish candles on the daily chart, Solana has now broken below the 50% Fibonacci support at $165.71. A daily close below this level would raise the probability of a deeper correction, potentially down to the psychological support near $150.
This $150 support zone coincides with the Supertrend indicator line at $149 and the 38.2% Fibonacci level at $148.82. Supporting this downside risk, the daily RSI has dipped below the midpoint, signaling waning bullish momentum.
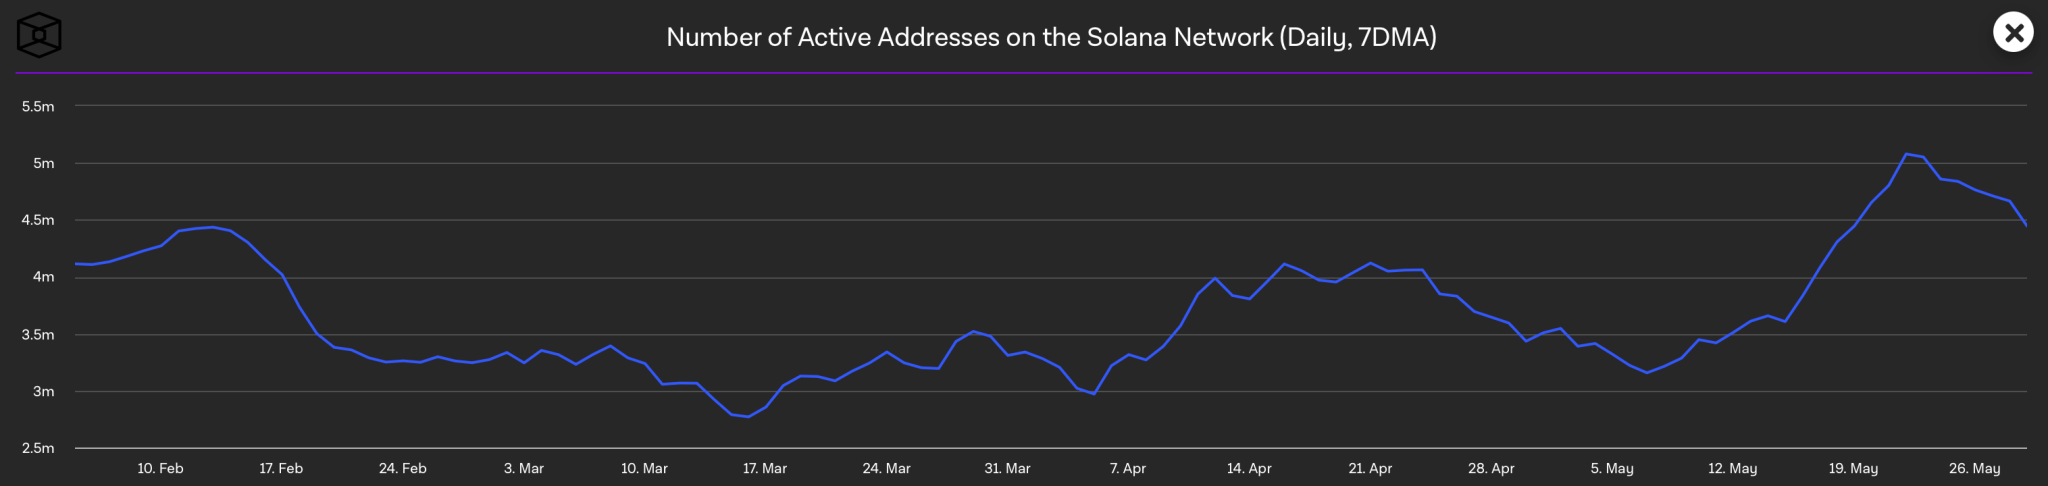
Solana Network Slows Down Amid Price Correction
Amid the steep price correction, Solana’s network activity has also declined. According to on-chain data, the number of active addresses on the network has dropped to 4.45 million, down from a 7-day peak of 5.08 million.
As network activity slows, the drop in active addresses may further reinforce the bearish trend.
Solana Price Chart
With three consecutive bearish candles on the daily chart, Solana has now broken below the 50% Fibonacci support at $165.71. A daily close below this level would raise the probability of a deeper correction, potentially down to the psychological support near $150.
This $150 support zone coincides with the Supertrend indicator line at $149 and the 38.2% Fibonacci level at $148.82. Supporting this downside risk, the daily RSI has dipped below the midpoint, signaling waning bullish momentum.
Solana Network Slows Down Amid Price Correction
Amid the steep price correction, Solana’s network activity has also declined. According to on-chain data, the number of active addresses on the network has dropped to 4.45 million, down from a 7-day peak of 5.08 million.
As network activity slows, the drop in active addresses may further reinforce the bearish trend.
By:
Previous
Ripple Exec Hails Bitcoin’s Green Leap: 50% Renewable Energy Benchmark Smashed
Next
Shiba Inu’s Sky-High Potential: What Happens if Bitcoin Hits $4.8M by 2040?
