BTCC
/
BTCC Square
/
Thecryptobasic
/
Ethereum’s $4K Breakout: Fueled by $33B in Open Interest or Just Another Trader Fantasy?
Ethereum’s $4K Breakout: Fueled by $33B in Open Interest or Just Another Trader Fantasy?

13
3
Ethereum bulls are back in force—open interest hits a staggering $33 billion as traders pile into ETH’s upward momentum. But is this the rocket fuel needed to blast past $4,000, or just leverage-heavy gamblers setting themselves up for a liquidation bloodbath?
Futures markets scream confidence, yet seasoned crypto vets know: when derivatives markets get this frothy, even a 2% dip can trigger cascading liquidations. Wall Street’s ’risk management’ algorithms are probably already licking their chops.
One thing’s certain: if ETH does moon, the suits will suddenly ’discover’ its utility—right after they finish front-running retail traders.
 Ethereum Price Chart
Thanks to this recovery, ethereum has broken out of a falling channel pattern, effectively ending the bearish trend that began in December 2024. Moreover, with the 50% Fibonacci level acting as the neckline, ETH is forming a rounding bottom pattern.
Rising bullish momentum has driven the RSI into the overbought zone, supporting this breakout trend and indicating strong buying pressure. Additionally, the 50—and 100-day EMA lines are on the verge of a bullish crossover. This signals a potential short-term trend reversal and increases the likelihood of a golden crossover.
If ETH achieves a decisive close above the 50% Fibonacci level at $2,699, a breakout could occur. The bullish target, based on adding the depth of the pattern to the neckline, points to the 100% Fibonacci level near $4,000. This suggests a potential 50% upside as the bull run continues.
On the downside, crucial support for ETH lies at the 200-day EMA at $2,436.
Bullish Narrative Grows Stronger in Ethereum Futures
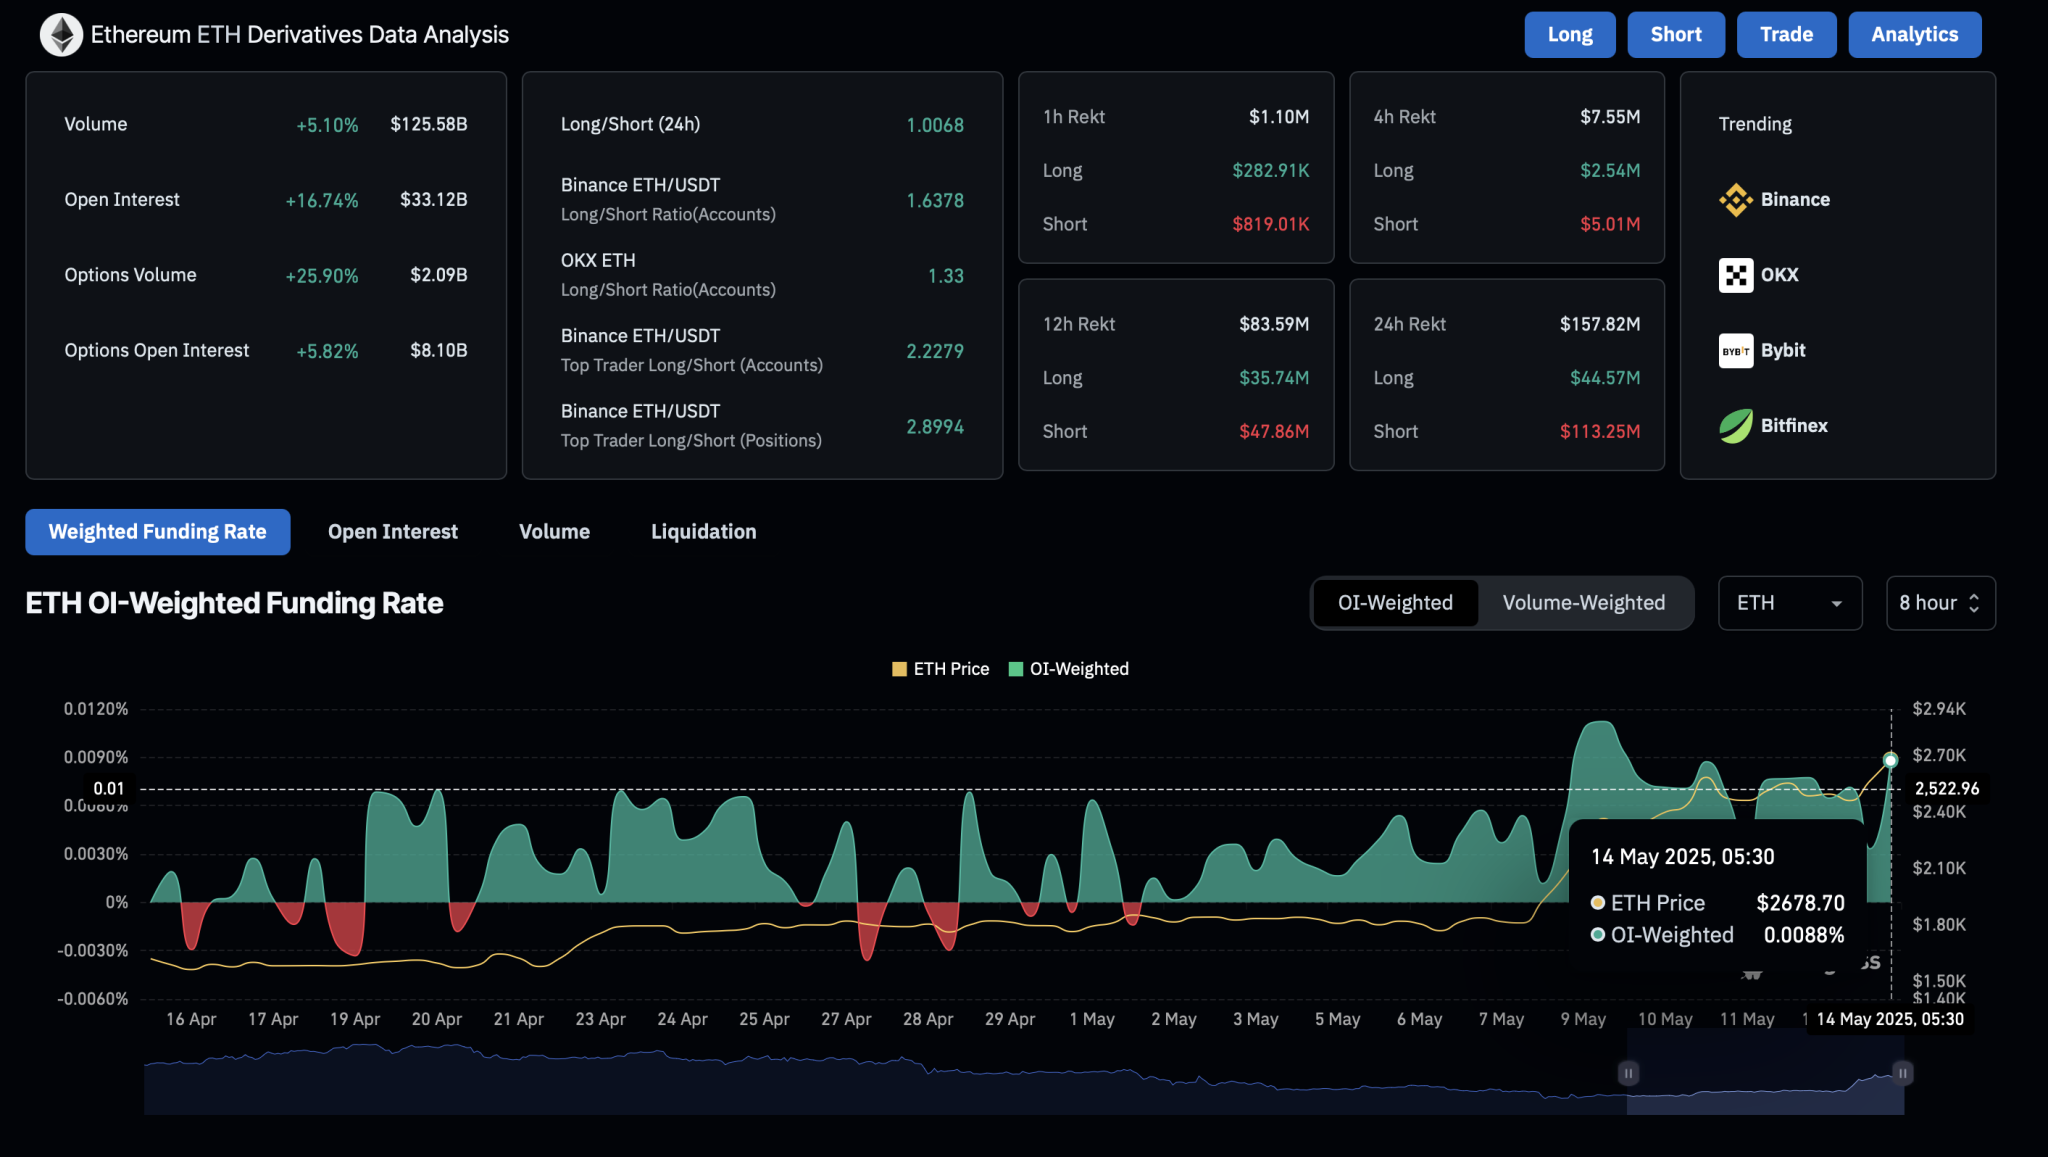
Derivative traders are betting big on Ethereum’s continued rally. According to CoinGlass data, Ethereum open interest has surged by nearly 17%, reaching an all-time high of $33.12 billion.
Ethereum Price Chart
Thanks to this recovery, ethereum has broken out of a falling channel pattern, effectively ending the bearish trend that began in December 2024. Moreover, with the 50% Fibonacci level acting as the neckline, ETH is forming a rounding bottom pattern.
Rising bullish momentum has driven the RSI into the overbought zone, supporting this breakout trend and indicating strong buying pressure. Additionally, the 50—and 100-day EMA lines are on the verge of a bullish crossover. This signals a potential short-term trend reversal and increases the likelihood of a golden crossover.
If ETH achieves a decisive close above the 50% Fibonacci level at $2,699, a breakout could occur. The bullish target, based on adding the depth of the pattern to the neckline, points to the 100% Fibonacci level near $4,000. This suggests a potential 50% upside as the bull run continues.
On the downside, crucial support for ETH lies at the 200-day EMA at $2,436.
Bullish Narrative Grows Stronger in Ethereum Futures
Derivative traders are betting big on Ethereum’s continued rally. According to CoinGlass data, Ethereum open interest has surged by nearly 17%, reaching an all-time high of $33.12 billion.
By:
Previous
Solana Bulls Charge Toward $261 as Derivatives Frenzy Ignites
Next
Bitcoin Smashes $104K as Whale Movements and Soaring Open Interest Signal Imminent ATH
