BTCC
/
BTCC Square
/
Thecryptobasic
/
XRP Rockets 500% in 60 Days—Here’s the MACD and Stoch RSI Combo That Called It
XRP Rockets 500% in 60 Days—Here’s the MACD and Stoch RSI Combo That Called It

14
1
When the stars align—or in this case, when two obscure trading indicators sync up—even Wall Street quants sit up straight. XRP just pulled off a 5x moonshot, and the charts saw it coming.
The MACD Crossover That Lit the Fuse
Bullish divergence on the Moving Average Convergence Divergence (MACD) flashed first, hinting at suppressed momentum ready to explode. Then came the hammer: Stoch RSI knifed through oversold territory like a hot wallet draining weak hands.
Timing the Tear
Retail traders who caught the dual signal in March 2025 are now vacationing on private islands—assuming they actually sold at the top instead of ’hodling’ for ’the community.’
Another reminder that crypto moves faster than SEC regulations—and leaves more wreckage.
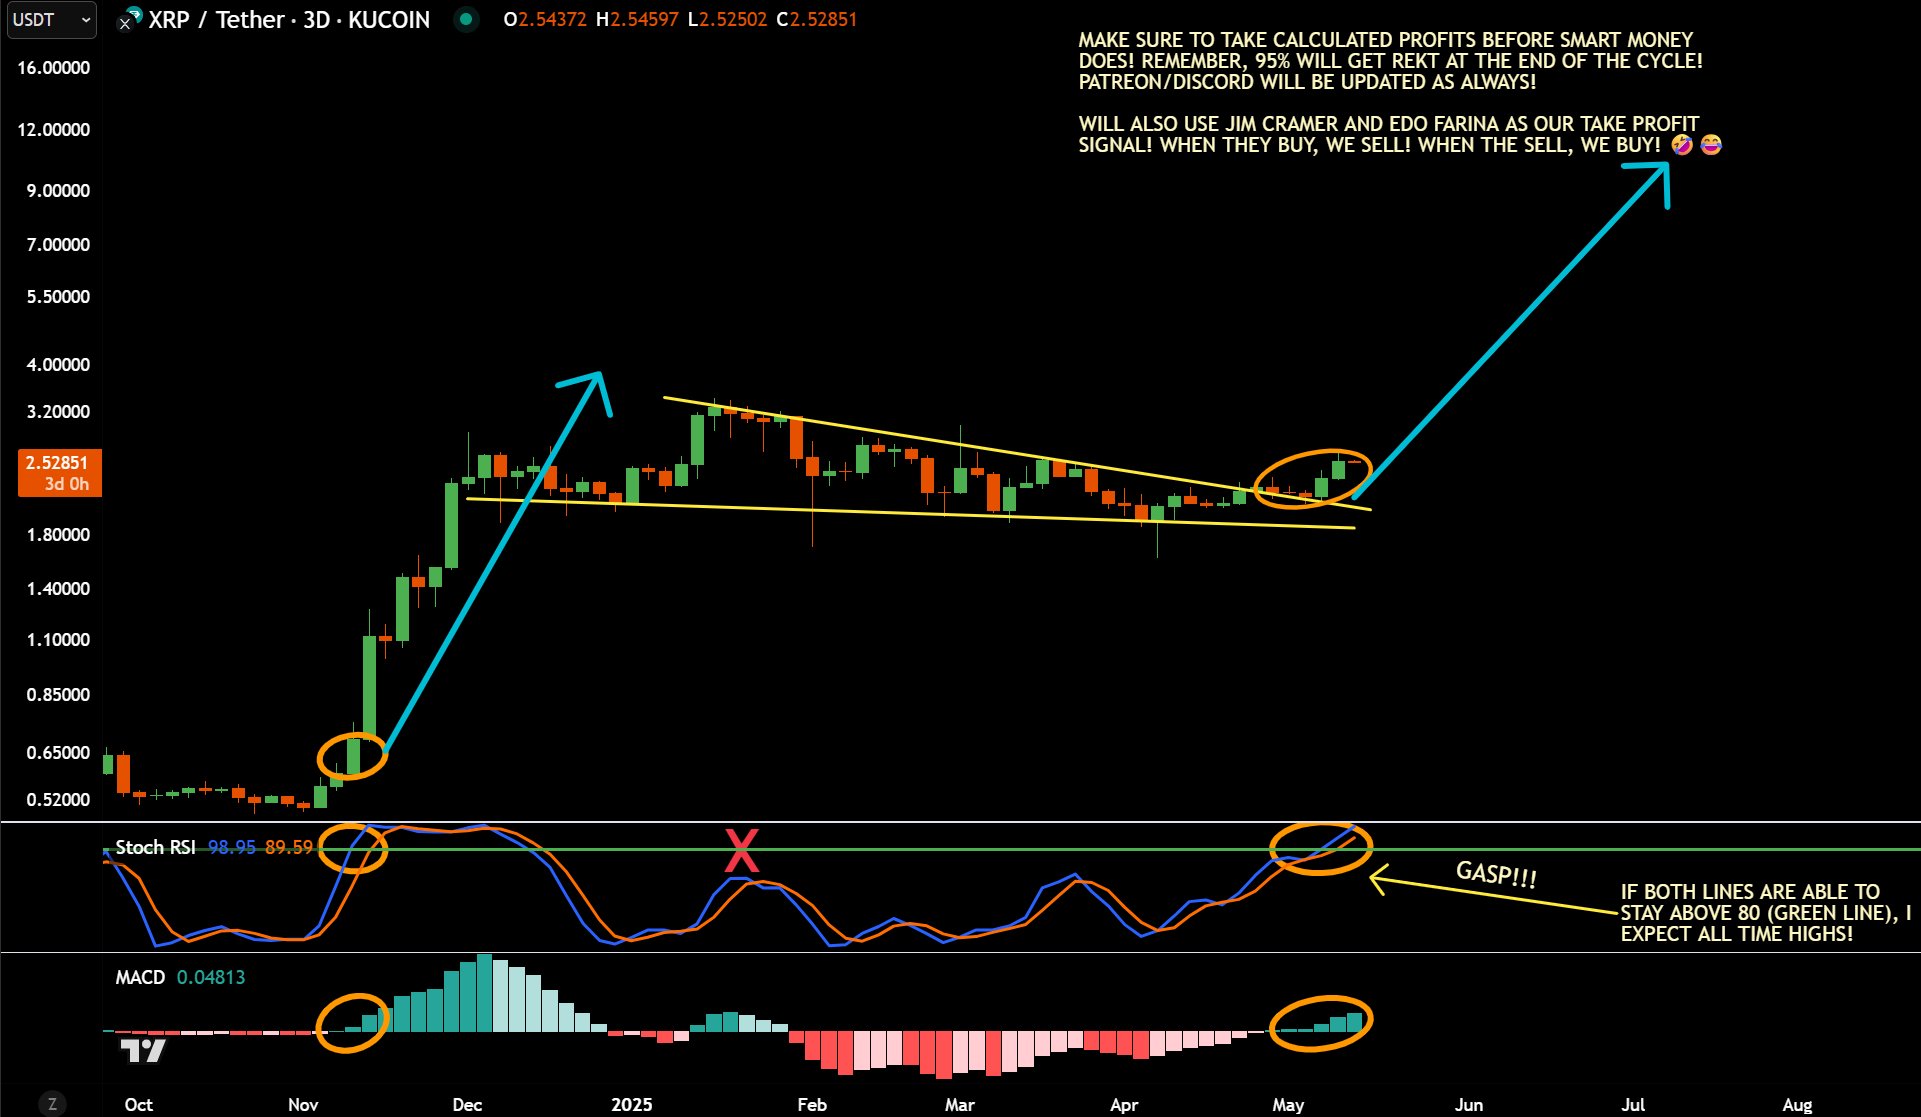 During that period, XRP moved from $0.50 to $3.30 in roughly two months. Interestingly, JD highlights that the rally began when the MACD histogram turned green, alongside a Stochastic RSI crossover above the 80 level.
In a similar fashion, XRP’s price action recently broke out of a falling wedge—a chart formation defined by lower highs and relatively steady lows—following a prolonged consolidation.
The breakout is supported by key indicators. Notably, the MACD histogram flipped green again in early May 2025. The Stochastic RSI also crossed above 80, with both lines sustaining that level at press time.
This technical alignment mirrors conditions from the late-2024 surge, where identical indicator behavior preceded a near fivefold increase. Notably, a fivefold increase from the current $2.49 WOULD take XRP to $12.45.
Buy When Jim Cramer Says Sell
A noteworthy point of caution is also included. JD urges traders to take calculated profits before the end of the cycle when "smart money" exits the market. The analyst emphasized that 95% of participants typically get "rekt" if they fail to exit in time.
He also humorously suggested using mainstream sentiment as a contrarian indicator, referencing media personalities like Jim Cramer: when these figures are bullish, the analyst suggests it may be time to sell, and vice versa.
Derivatives Metrics Indicate Growing Bullish Bias
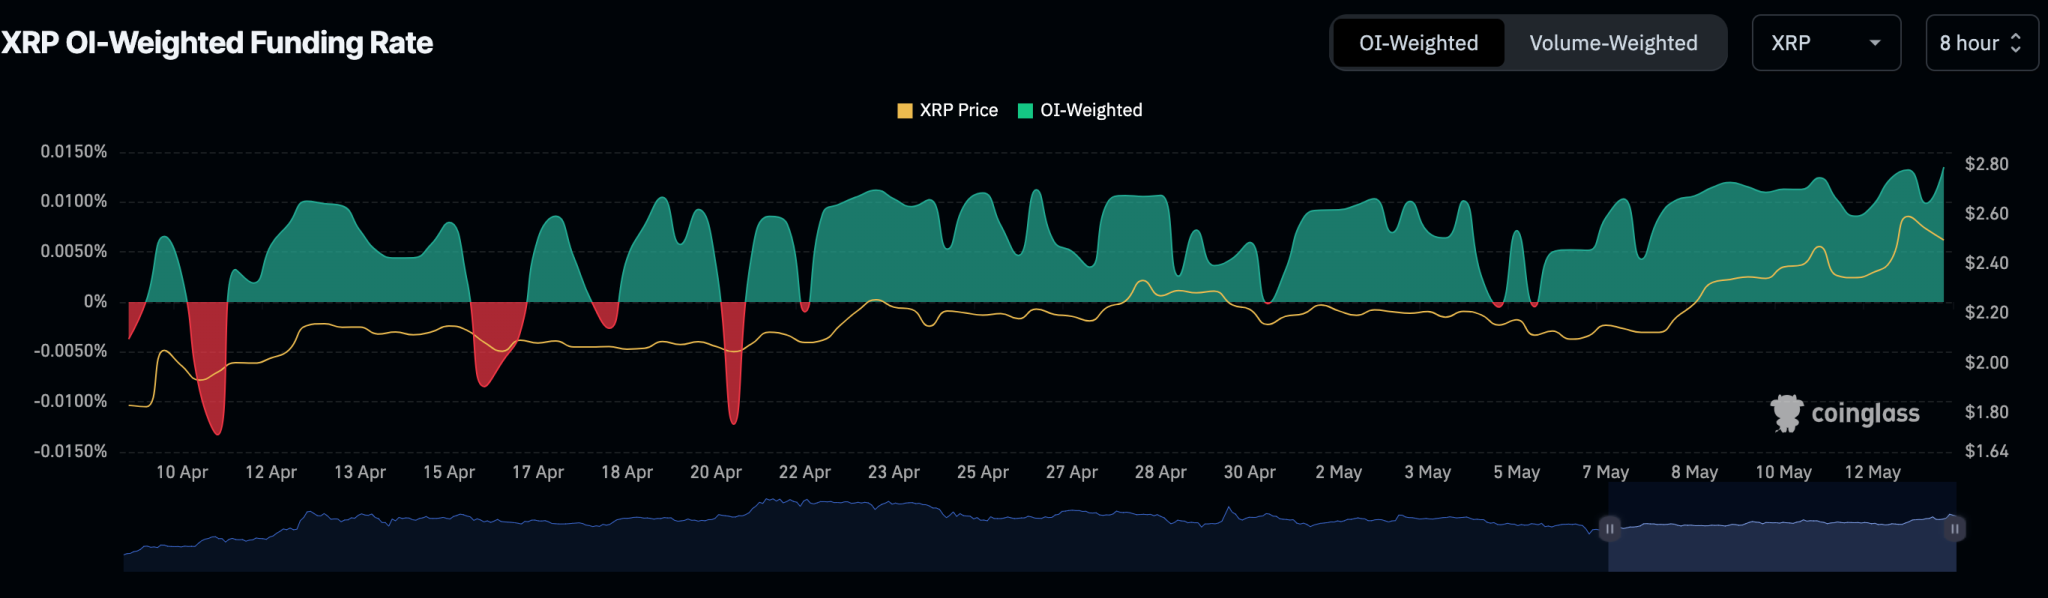
Alongside price and indicator signals, derivatives data is also bullish. According to Coinglass, XRP’s OI-weighted funding rate has maintained a consistently positive trajectory since the beginning of May. This marks a shift from April, where funding oscillated around neutral, including multiple dips into negative territory.
During that period, XRP moved from $0.50 to $3.30 in roughly two months. Interestingly, JD highlights that the rally began when the MACD histogram turned green, alongside a Stochastic RSI crossover above the 80 level.
In a similar fashion, XRP’s price action recently broke out of a falling wedge—a chart formation defined by lower highs and relatively steady lows—following a prolonged consolidation.
The breakout is supported by key indicators. Notably, the MACD histogram flipped green again in early May 2025. The Stochastic RSI also crossed above 80, with both lines sustaining that level at press time.
This technical alignment mirrors conditions from the late-2024 surge, where identical indicator behavior preceded a near fivefold increase. Notably, a fivefold increase from the current $2.49 WOULD take XRP to $12.45.
Buy When Jim Cramer Says Sell
A noteworthy point of caution is also included. JD urges traders to take calculated profits before the end of the cycle when "smart money" exits the market. The analyst emphasized that 95% of participants typically get "rekt" if they fail to exit in time.
He also humorously suggested using mainstream sentiment as a contrarian indicator, referencing media personalities like Jim Cramer: when these figures are bullish, the analyst suggests it may be time to sell, and vice versa.
Derivatives Metrics Indicate Growing Bullish Bias
Alongside price and indicator signals, derivatives data is also bullish. According to Coinglass, XRP’s OI-weighted funding rate has maintained a consistently positive trajectory since the beginning of May. This marks a shift from April, where funding oscillated around neutral, including multiple dips into negative territory.
By:
Previous
US Inflation Misses Forecasts—Bitcoin Primed for Volatility Surge
Next
Shiba Inu Hits $0.001 Without Flipping Bitcoin—Here’s How the Math Actually Works
