Litecoin Primed for 50% Surge—Here’s the Make-or-Break Factor

Litecoin's chart flashes bullish signals as traders eye a potential 50% rally—but market veterans know crypto never plays nice.
The silver to Bitcoin's gold is carving out a critical pattern. Breakout or fakeout? Technicals lean bullish, but liquidity hunters lurk.
Key levels to watch: Litecoin needs to hold support here, smash resistance there. Standard crypto volatility—just another Tuesday.
Meanwhile, Wall Street 'experts' still can't tell LTC from a Starbucks loyalty token. Some things never change.

Key Insights:
- Litecoin price prediction suggests a 50% upside, but whales may take profit soon.
- LTC price faces resistance near $129 despite rising open interest and strong momentum.
- Exchange inflows and CMF divergence hint at a short-term pullback before higher targets.
Litecoin has crossed the $120 mark again and is up over 10% on the daily chart. The crypto market is warming up, and the LTC price is riding the wave. But can this rally continue?
While the Litecoin price prediction figure is still far from its all-time high of $410, traders are starting to ask, could this be the beginning of a bigger breakout?
Let’s break down the market story using open interest, netflows, liquidation maps, and price charts. But be warned: while a 50% rally is technically on the table, there are a few things that might slow it down.
Open Interest Picks Up, but So Does Profit Booking
The first bullish signal for this litecoin price prediction is rising open interest. This basically means more money is entering LTC futures.
Open interest crossed $1 billion in late July and remains strong, showing traders are putting their bets on the price moving higher.

But there’s a twist.
Spot market netflows just flipped positive. That means more LTC is moving into exchanges than leaving them. Usually, this happens when people want to sell, not buy.
So while futures traders are betting in favor of bulls, spot traders might be taking profits. If this continues, the Litecoin price could get stuck in a sideways move between $115 and $130.

Liquidation Map and CMF Show Longs Dominating
If you look at Bitget’s LTC/USDT liquidation map, long traders clearly dominate. Over $105 million in Leveraged long positions sit below the $120 zone.
Shorts, on the other hand, are barely touching $43 million. This shows most traders believe in the rally.
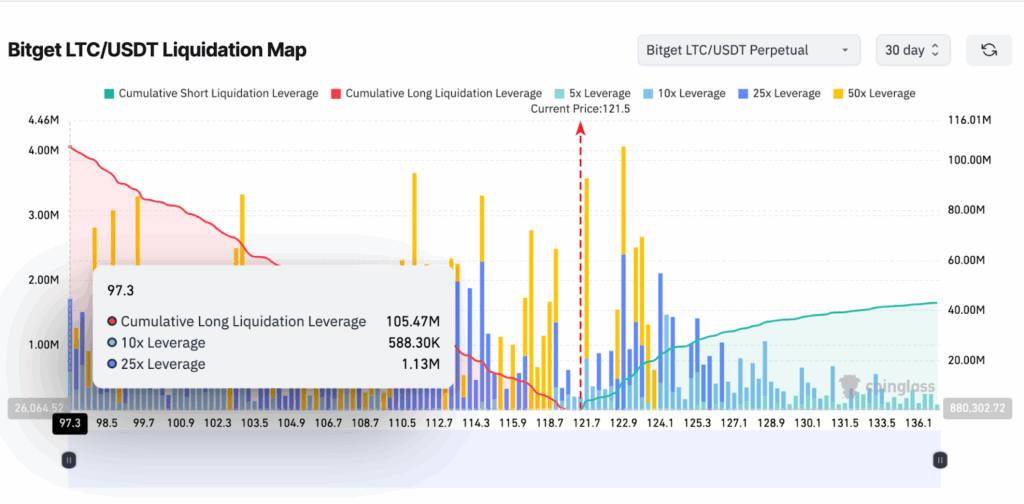
But here’s the catch: if the price suddenly dips, all those long positions could get liquidated. That WOULD cause a sharp drop, like a snowball effect. So while the bias is bullish, it’s also fragile.
The Chaikin Money FLOW (CMF) indicator adds some more clarity to the expected consolidation.
Between July 27 and August 5, LTC made a higher high in price, but CMF made a lower high. That’s called a bearish divergence. It doesn’t mean price will crash, but it’s a warning that the buying strength is fading.

So yes, Litecoin Price prediction still supports a rally, but not without some weakness along the way.
Litecoin Price Prediction Targets a 50% Jump
LTC price is currently trading NEAR $121. Based on a Fibonacci extension drawn from the June low of $76 to the July peak of $121 (with a retracement to $106), the next major target is at $181. That’s about 50% higher than current levels.

But to get there, bulls need to push past smaller resistance zones: $129, $135, $152, and finally $181. That means the rally won’t be one big jump. It’s going to need volume, sentiment, and consistent momentum.
That’s where social chatter helps. Twitter (now X) posts are buzzing about Litecoin’s 6-year LTC/BTC resistance line potentially breaking.

Another post points to $150 as the next big target, with rising volume and momentum. This kind of talk creates hype, and sometimes HYPE can help push the price through tough resistance.

To sum it up, this Litecoin price prediction sees a path to $181, a 50% rally from today’s level. But the journey won’t be easy.
