Dogecoin Primed for 50% Surge—Key Indicators Flash Buy Signal Ahead of $0.30 Breakout

Memecoin's moon mission gets serious as technical stars align.
Forget the Elon tweets—this time, the charts are doing the talking. Dogecoin's price action just triggered three classic bullish signals that historically precede major runs. And no, we're not talking about that time your Uber driver said 'DOGE to $1' between wrong turns.
Key levels to watch
The $0.20 support held like a diamond-handed Shiba Inu during last week's market dip. Now, the 50-day moving average is curling upward like a rocket preparing for liftoff. Meanwhile, the RSI cooled off from overbought territory without crashing—the perfect setup for institutional bag-holders to pretend they 'always believed' in the joke coin.
Volume tells the real story
Spot trading volume spiked 40% during Tuesday's breakout, while derivatives open interest remained stable—a rare combo that suggests actual buying pressure rather than leveraged gamblers playing with house money. Even the Bitcoin maximalists on Crypto Twitter paused their usual trolling to check their DOGE shorts.
The punchline? This rally might actually have fundamentals (if you count 'not being completely absurdly valued anymore' as a fundamental). Next stop $0.30, assuming Wall Street's pet meme coin ETF doesn't derail things by being 'for your protection.'

Dogecoin (DOGE) price showed renewed strength trends, with technical indicators approaching multi-setup convergence.
Analysts monitoring its price action have cited the presence of similar patterns and RSI alignment. Consequently, this indicated that momentum could be gaining traction in the FORM of a potential surge to the $0.30 mark.
Dogecoin Price Rising Wedge Formation Mirrors Previous Breakouts
Notably, Dogecoin price chart revealed that the meme coin had created a rising wedge pattern following the development of two rounded bottoms.
Trader Tardigrade observed that this trend followed a similar layout to earlier levels in 2023 and the first half of 2024.
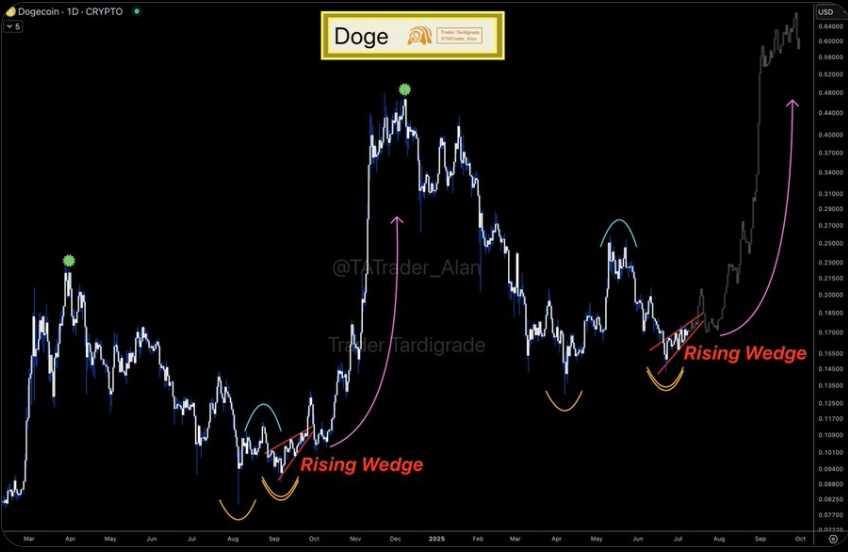
Additionally, each of those historical instances began with a bottoming phase. That was followed by a steady rise in price that broke out of the wedge formation with elevated trading volume.
In the most recent case, the wedge began forming in June 2025. It has been consolidating upward while holding higher lows.
The structure was characterized by narrowing price movements within upward-sloping trendlines.
According to chart interpretations, the breakout potential of such patterns is elevated when preceded by accumulation at support.
This is especially when the price has responded positively at similar chart zones in the past.
RSI Bounce Reinforce the Uptrend Within a Channel
Along with the wedge formation, dogecoin price also moved within the ascending channel on the daily chart.
Since early April 2025, the upper and lower trend lines of this channel have been setting the price action.
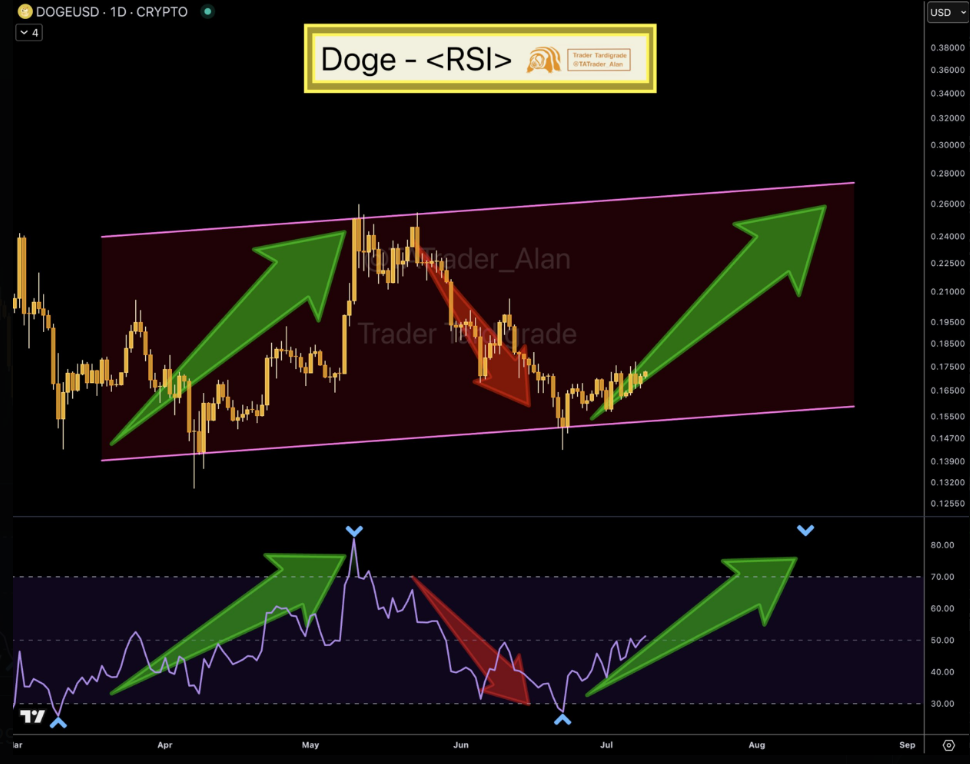
DOGE price was persistently touching the lower support line and bouncing off it to reach the upper resistance line.
The meme coin price has respected the channel with several cycles, showing a directional bias.
Concurrently, the Relative Strength Index (RSI) has been characterised by distinct fluctuations that are in line with these price fluctuations.
In June, when the meme coin tapped the lower channel boundary, the RSI also went into oversold territory and started a steady climb.
Besides, this trend has recurred on numerous occasions, where every time the RSI bounces off the 30 mark, it has been followed up by rallying prices.
At the moment, the RSI displayed an upward trend, indicating a possible lengthening of the bullish movement.
Double Bottom Pattern Strengthens Bullish Case
Another technical indicator that appeared on Dogecoin price chart was a double bottom formation around the $0.15 support level.
Notably, this level has been a solid support in the last couple of months, and recent price action indicated two clear touches at that level with a moderate rally in between.

Subsequently, should the Doge price continue to rise and definitively overcome the level of $0.18-$0.19 range, this would be a double bottom. As a result, it may signal a reversal trend to a bullish trend.
A confirmed double bottom frequently indicates a change in the structure of the market, with sellers losing power and buyers starting to re-enter the market. The pattern neckline was around the $0.18 level.
Moreover, an upward break of this level may cause greater resistance set at the levels of $0.25 and possibly higher at the level of $0.30. These levels correspond to former support turned resistance levels on the long-term chart.
At the time of writing, dogecoin price traded at $0.18, up 6% in 24 hours, holding above $0.17 support and eyeing a breakout above $0.20 resistance zone.
