XRP Price Rebound Hits Critical Resistance – Technical Indicators Flash Warning Signs for Near-Term Gains

XRP's recent recovery momentum slams into formidable technical barriers that could cap further upside potential.
Technical Wall Emerges
The digital asset's bounce confronts multiple resistance levels that have historically triggered pullbacks. Key moving averages and Fibonacci retracement levels create a convergence of selling pressure that bulls must overcome.
Momentum Indicators Weaken
While trading volume shows modest improvement, momentum oscillators suggest the rebound lacks conviction. RSI readings hover near overbought territory without corresponding breakout volume—a classic divergence pattern that often precedes corrections.
Market Structure Challenges
XRP faces the same technical hurdles that have repeatedly thwarted recovery attempts throughout 2025. The asset struggles to maintain momentum above critical psychological price levels that institutional traders monitor closely.
Remember when traditional analysts said crypto couldn't form coherent technical patterns? Now they're using those same patterns to explain why your bags aren't pumping.
XRP Price Declines Sharply
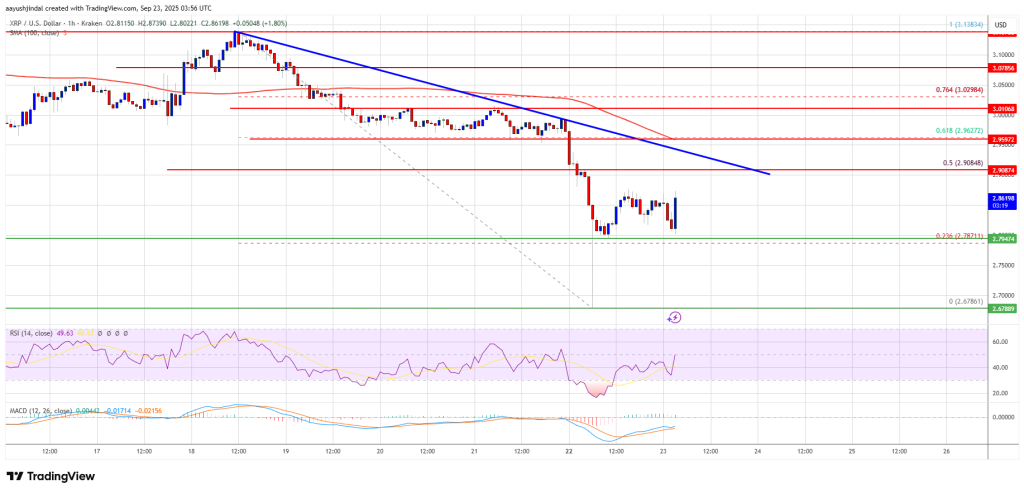
XRP price failed to extend gains above $3.120 and started a fresh decline, like Bitcoin and Ethereum. The price dipped below the $3.00 and $2.920 support levels.
The bears even pushed the price below $2.80. A low was formed NEAR the $2.678 support, and the price is now correcting some losses. There was a move above the 23.6% Fib retracement level of the recent decline from the $3.138 swing high to the $2.678 low.
The price is now trading below $2.90 and the 100-hourly Simple Moving Average. Besides, there is a bearish trend line forming with resistance at $2.920 on the hourly chart of the XRP/USD pair. If the bulls protect the $2.80 support, the price could attempt a steady recovery.
On the upside, the price might face resistance near the $2.90 level. The first major resistance is near the $2.920 level and the trend line. It is close to the 50% Fib retracement level of the recent decline from the $3.138 swing high to the $2.678 low.
A clear MOVE above the $2.920 resistance might send the price toward the $3.00 resistance. Any more gains might send the price toward the $3.050 resistance. The next major hurdle for the bulls might be near $3.120.
Another Decline?
If XRP fails to clear the $2.920 resistance zone, it could continue to move down. Initial support on the downside is near the $2.820 level. The next major support is near the $2.80 level.
If there is a downside break and a close below the $2.80 level, the price might continue to decline toward $2.740. The next major support sits near the $2.650 zone, below which the price could gain bearish momentum.
Technical Indicators
Hourly MACD – The MACD for XRP/USD is now losing pace in the bearish zone.
Hourly RSI (Relative Strength Index) – The RSI for XRP/USD is now below the 50 level.
Major Support Levels – $2.820 and $2.80.
Major Resistance Levels – $2.90 and $2.920.
