Ethereum Price Squeezes to Breaking Point – Brace for Explosive Move Any Moment

Ethereum's trading range tightens to near-paralytic levels—volatility compression hitting extremes not seen in months.
Technical Tension Builds
Bollinger Bands pinch to their narrowest since Q2, signaling pent-up energy that typically precedes major price movements. The 20-day moving average flattens—classic consolidation pattern before the storm.
Liquidity Vacuum Ahead
Thin order books amplify breakout risks. Market makers pull quotes as spot liquidity evaporates—just waiting for one large player to trigger the domino effect. Retail traders cluster around same strike prices, creating perfect conditions for a violent squeeze.
Institutional Positioning Adds Fuel
Futures open interest holds near record highs while funding rates normalize. Smart money accumulates quietly—no fireworks yet, but the powder keg's packed. Options flow shows asymmetric bets on upside moves through quarterly expiries.
Macro Winds Shift
Traditional markets wobble as bond yields spike—capital rotation into crypto accelerates. ETH's correlation with tech stocks drops to 6-month lows, decoupling at the perfect time. (Because nothing says 'hedge against inflation' like digital assets trading at 100x revenue multiples.)
Next move likely determines trend for Q4—break north and we test all-time highs; break south and it's a swift return to support clusters. No middle ground remains.
Ethereum Price Eyes Upside Break
Ethereum price formed a base above $4,420 and started a recovery wave, like Bitcoin. ETH price was able to settle above the $4,500 and $4,520 levels.
The price climbed above the $4,550 and $4,600 resistance levels. The bulls pushed the price above the 50% Fib retracement level of the downward wave from the $4,765 swing high to the $4,416 low. However, the bears are active NEAR the $4,640 level.
The price is facing hurdles near the 61.8% Fib retracement level of the downward wave from the $4,765 swing high to the $4,416 low. ethereum price is now trading above $4,550 and the 100-hourly Simple Moving Average.
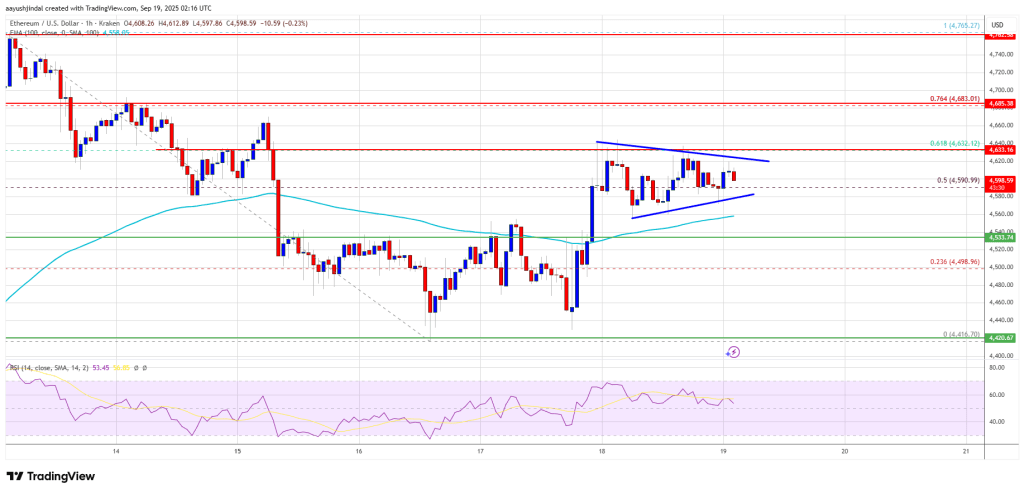
On the upside, the price could face resistance near the $4,640 level. The next key resistance is near the $4,685 level. The first major resistance is near the $4,765 level. A clear MOVE above the $4,765 resistance might send the price toward the $4,840 resistance. An upside break above the $4,840 region might call for more gains in the coming sessions. In the stated case, Ether could rise toward the $4,880 resistance zone or even $4,920 in the near term.
Another Pullback In ETH?
If ethereum fails to clear the $4,640 resistance, it could start a fresh decline. Initial support on the downside is near the $4,580 level. The first major support sits near the $4,535 zone.
A clear move below the $4,535 support might push the price toward the $4,465 support. Any more losses might send the price toward the $4,420 region in the near term. The next key support sits at $4,350.
Technical Indicators
Hourly MACDThe MACD for ETH/USD is losing momentum in the bullish zone.
Hourly RSIThe RSI for ETH/USD is now above the 50 zone.
Major Support Level – $4,535
Major Resistance Level – $4,640
