Dogecoin Bottom In? Confluence Of Signals Screams Yes

DOGE finds its floor as multiple indicators align—just as the meme crowd predicted.
Technical Breakthrough
Key support levels held firm while trading volume spiked—classic reversal patterns flashing green across the board.
Market Sentiment Shift
Whales accumulate while retail FOMO builds momentum, creating perfect conditions for an upward surge.
Macro Factors at Play
Broader crypto recovery bypasses traditional finance skepticism—because who needs fundamentals when you've got memes?
The stars align for DOGE's comeback tour, proving once again that in crypto, logic takes a backseat to collective delusion.
What This Means For Dogecoin Price
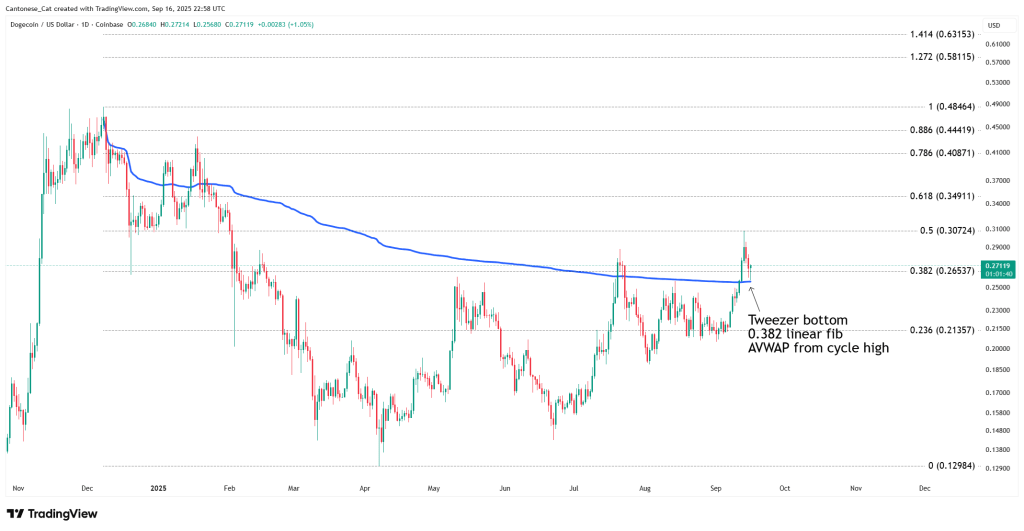
For readers less familiar with the terms, a “tweezer bottom” is a two-bar reversal formation in which consecutive candles print almost identical lows after a decline. The repeated low shows that dip buyers defended the same price on back-to-back sessions, and the intraday wicks rejecting that level often indicate absorption of sell pressure. In the chart, the twin lows cluster exactly into the $0.265 area, giving a clean reference for risk.
On higher timeframes such as the daily, this pattern is watched because it defines a precise inflection without requiring a long basing process; confirmation is typically evaluated by whether subsequent candles hold above those lows and push through the interim highs of the pattern.
The 0.382 “linear fib” refers to a 38.2% Fibonacci retracement calculated on a linear price scale from the prior swing extremes drawn on the chart. In practical terms, it marks a shallow retracement level where trends frequently pause or resume. Here, that retracement prints at $0.26537, almost perfectly overlapping the tweezer lows. “Holding” in the analyst’s note means price probed the level intraday but closed back above it, preserving it as support rather than converting it to resistance.
AVWAP—the Anchored Volume-Weighted Average Price—is the running average price of all trades since a chosen starting point, weighted by traded volume, with that starting point “anchored” to a specific candle. The anchor here is the cycle high visible on the left side of the chart. Functionally, this AVWAP (drawn as the blue band) represents the composite cost basis of market participants from that top onward.
When price is below an AVWAP anchored to a major high, it often behaves as dynamic resistance because many holders are underwater; when price reclaims it, the same line can flip into dynamic support as the average participant moves back to break-even or profit. On this chart, the AVWAP is sloping through $0.265–$0.27 and “holding,” meaning successive tests have found buyers along that band, precisely where the 0.382 retracement and tweezer lows coincide.
Technically, that three-way overlay—pattern, retracement, and anchored cost basis—is what traders call confluence. It improves the quality of a level because different methods, derived from different data (price structure, proportional retracement, and volume distribution over time), all argue for the same zone.
Where Is DOGE Heading Next?
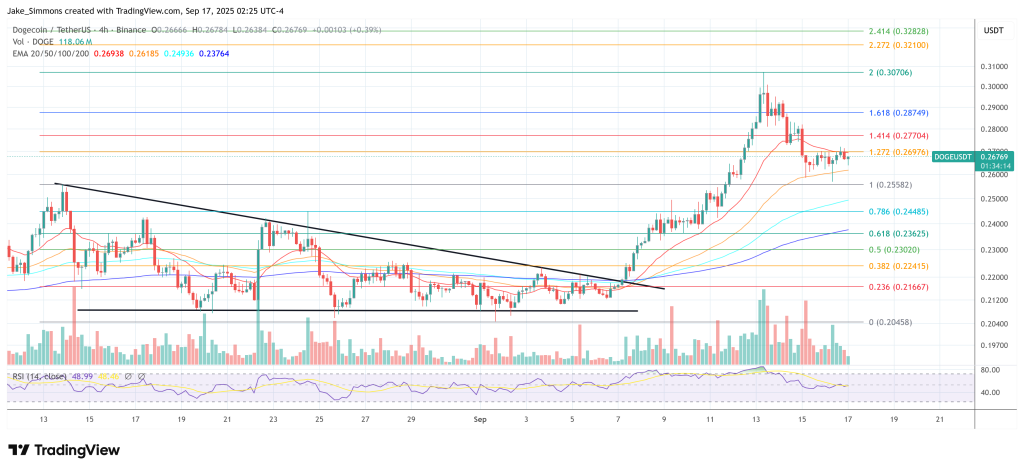
The chart also frames the next directional checkpoints. The nearest marked resistance is the 0.5 retracement at $0.30724, which capped the latest advance before the pullback into $0.265.
Above that, the Fibonacci ladder steps to $0.34911 (0.618), $0.40871 (0.786), $0.44419 (0.886), and $0.48464 (1.000), with extensions labeled at $0.58115 (1.272) and $0.63153 (1.414). If the confluence at $0.265 were to fail on a closing basis, the next plotted downside reference on this template is the 0.236 retracement at $0.21357, while the bottom of the displayed range sits at $0.12984.
Put together, the chart Cantonese Cat shared communicates a straightforward message: Doge tested a cluster of technical supports at $0.265, produced a tweezer-style reaction there, and is attempting to stabilize above both the 0.382 retracement and the AVWAP from the cycle high. That is the specific technical context behind the analyst’s “local bottom” read.
At press time, DOGE traded at $0.267.