BNB Price Holds Its Uptrend – Key Levels That Could Trigger More Gains

BNB defies gravity as bullish momentum builds—traders eye critical resistance levels for the next leg up.
Technical Breakout Imminent
The token's consolidation above key support suggests institutional accumulation. Every dip gets bought faster than a meme coin pump—real money positioning for the next rally.
Key Levels To Watch
Break above $700 could trigger FOMO-driven acceleration toward previous ATHs. Meanwhile, the $550 zone acts as concrete support—because even in crypto, some things shouldn't drop below certain pay grades.
Market Structure Intact
Higher lows pattern remains undisturbed despite macro headwinds. Traditional finance still doesn't get it—they're busy shorting while smart money stacks BNB for the coming altseason.
BNB Price Eyes More Gains
BNB price formed a base above the $880 level and started a fresh increase, beating ethereum and Bitcoin. There was a steady move above the $892 and $920 levels.
The bulls even cleared the $935 resistance zone. A new all-time high was formed at $950 and the price is now consolidating gains. There was a minor decline below the 23.6% Fib retracement level of the upward MOVE from the $871 swing low to the $950 high.
The price is now trading above $920 and the 100-hourly simple moving average. Besides, there is a key bullish trend line forming with support at $925 on the hourly chart of the BNB/USD pair.
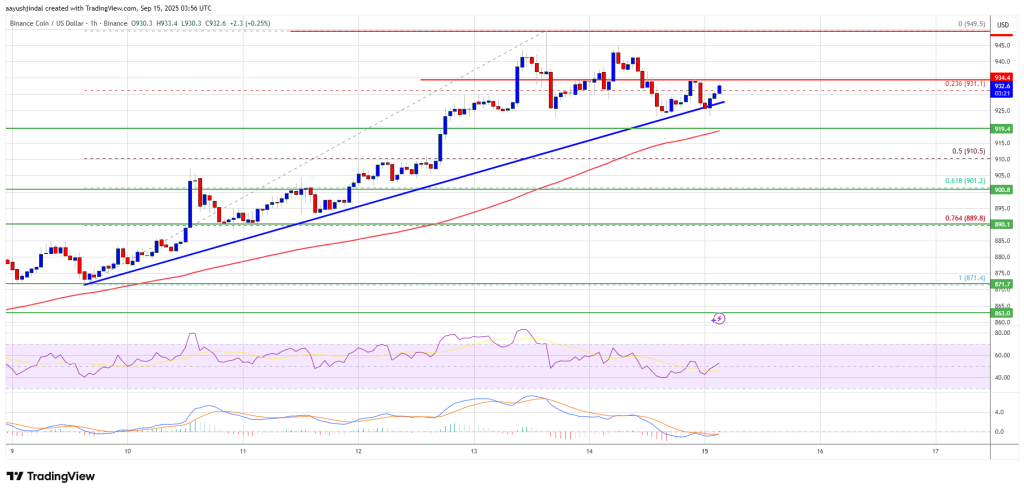
On the upside, the price could face resistance near the $935 level. The next resistance sits near the $942 level. A clear move above the $942 zone could send the price higher. In the stated case, BNB price could test $950. A close above the $950 resistance might set the pace for a larger move toward the $965 resistance. Any more gains might call for a test of the $1,000 handle in the near term.
Downside Correction?
If BNB fails to clear the $935 resistance, it could start another decline. Initial support on the downside is near the $920 level. The next major support is near the $910 level or the 50% Fib retracement level of the upward move from the $871 swing low to the $950 high.
The main support sits at $900. If there is a downside break below the $900 support, the price could drop toward the $888 support. Any more losses could initiate a larger decline toward the $872 level.
Technical Indicators
Hourly MACD – The MACD for BNB/USD is gaining pace in the bullish zone.
Hourly RSI (Relative Strength Index) – The RSI for BNB/USD is currently above the 50 level.
Major Support Levels – $925 and $910.
Major Resistance Levels – $935 and $950.
