Solana Price Forecast: SOL Eyes Record Highs as Institutional Demand & On-Chain Metrics Fuel Rally

Solana's charging toward new all-time highs—and this time, institutional money's leading the charge.
Institutional Inflows Surge
Big players are stacking SOL like it's going out of style. Hedge funds, family offices, even traditional finance giants are diving into Solana's ecosystem—betting on its speed and scalability over older, clunkier chains.
On-Chain Metrics Don't Lie
Activity's exploding. Transaction volumes hit record levels, network usage stays robust, and developer engagement hasn't slowed. It's not just retail FOMO driving this—foundations are solid.
Market Momentum Builds
SOL's price action looks unstoppable. Breaks through resistance like it's not even there. Traders are positioning for a run past previous peaks—momentum's clearly bullish.
Just don't ask the traditional finance guys—they're still trying to figure out how to short it with paperwork.
Solana’s on-chain and derivatives data signal strengthening bullish momentum
Data from crypto intelligence tracker DefiLlama shows that Solana’s Total Value Locked (TVL) increase reached a new all-time high (ATH) of $13.22 billion on Sunday. This increase in TVL indicates growing activity and interest within Solana’s ecosystem, suggesting that more users are depositing or utilizing assets within SOL-based protocols.
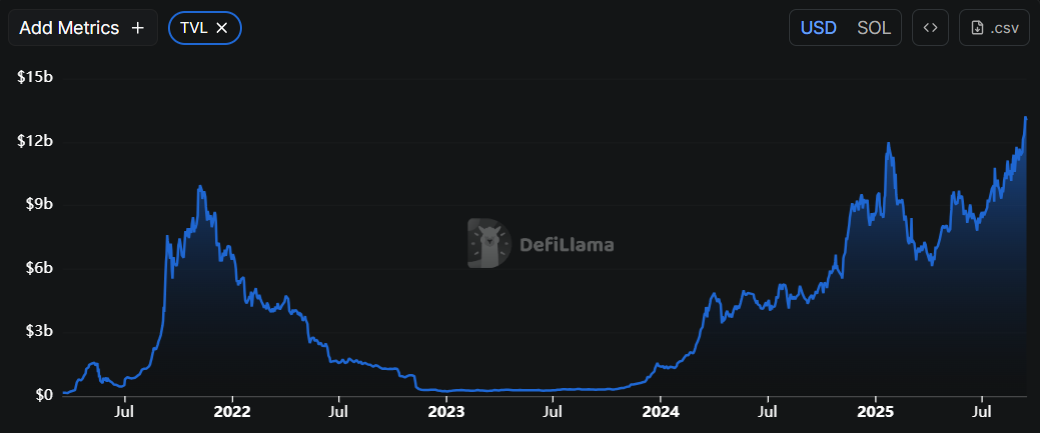
Solana TVL chart. Source: DefiLlama
Artemis Terminal data further hints at a bullish outlook, as stablecoin supply on the network surged by over $255 million in the last 24 hours, the largest increase among major blockchains. SOL outpaced rivals like Arbitrum (ARB) and Aptos (APT), underscoring rising demand and strengthening ecosystem growth.
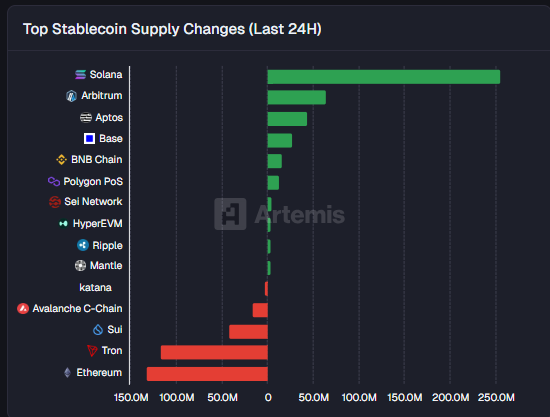
Total stablecoin supply changes (last 24 hours) chart. Source: Artemis terminal
On the derivatives front, Solana continues to strengthen. CoinGlass’ data below shows that the futures’ Open Interest (OI) in Solana at exchanges reached a new all-time high of $16.58 billion on Monday. An increasing OI represents new or additional money entering the market and new buying, which could fuel the current Solana price rally.
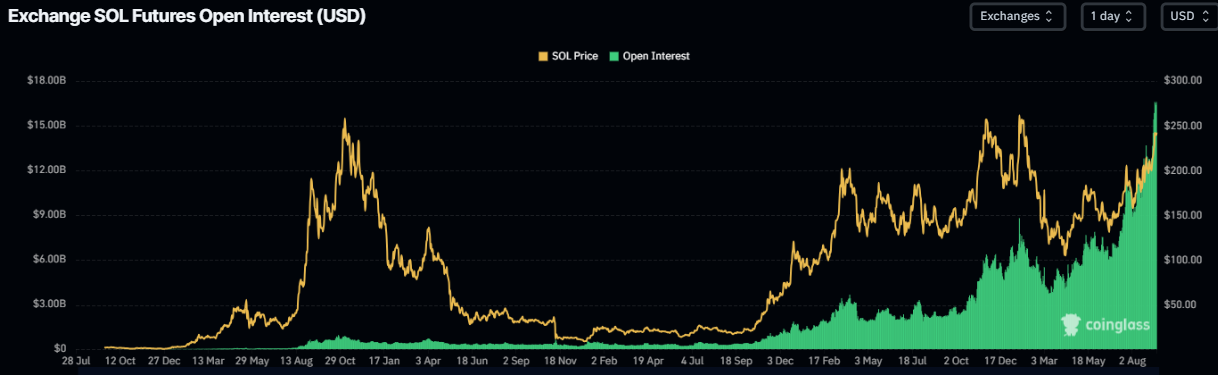
Solana open interest chart. Source: Coinglass
Solana’s Coinglass long-to-short ratio reads 1.08 on Monday, the highest level in over a month. This ratio, above one, reflects bullish sentiment in the markets, as more traders are betting on the SOL price to rise.
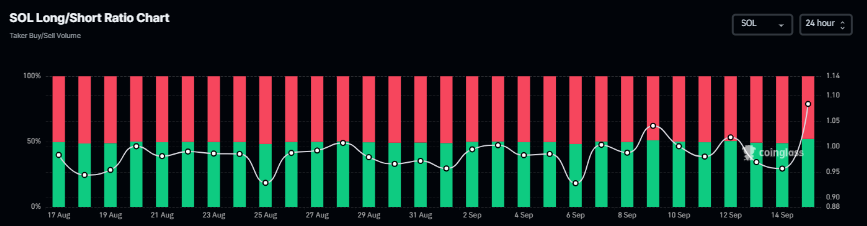
Solana long-to-short ratio chart. Source: Coinglass
Institutional demand supports the SOL to rise further
Institutional demand for solana continued to strengthen last week. Forward Industries announced on Thursday that it had completed a $1.65 billion private investment in public equity (PIPE) deal, led by Galaxy Digital (Galaxy), Jump Crypto, and Multicoin Capital (Multicoin).
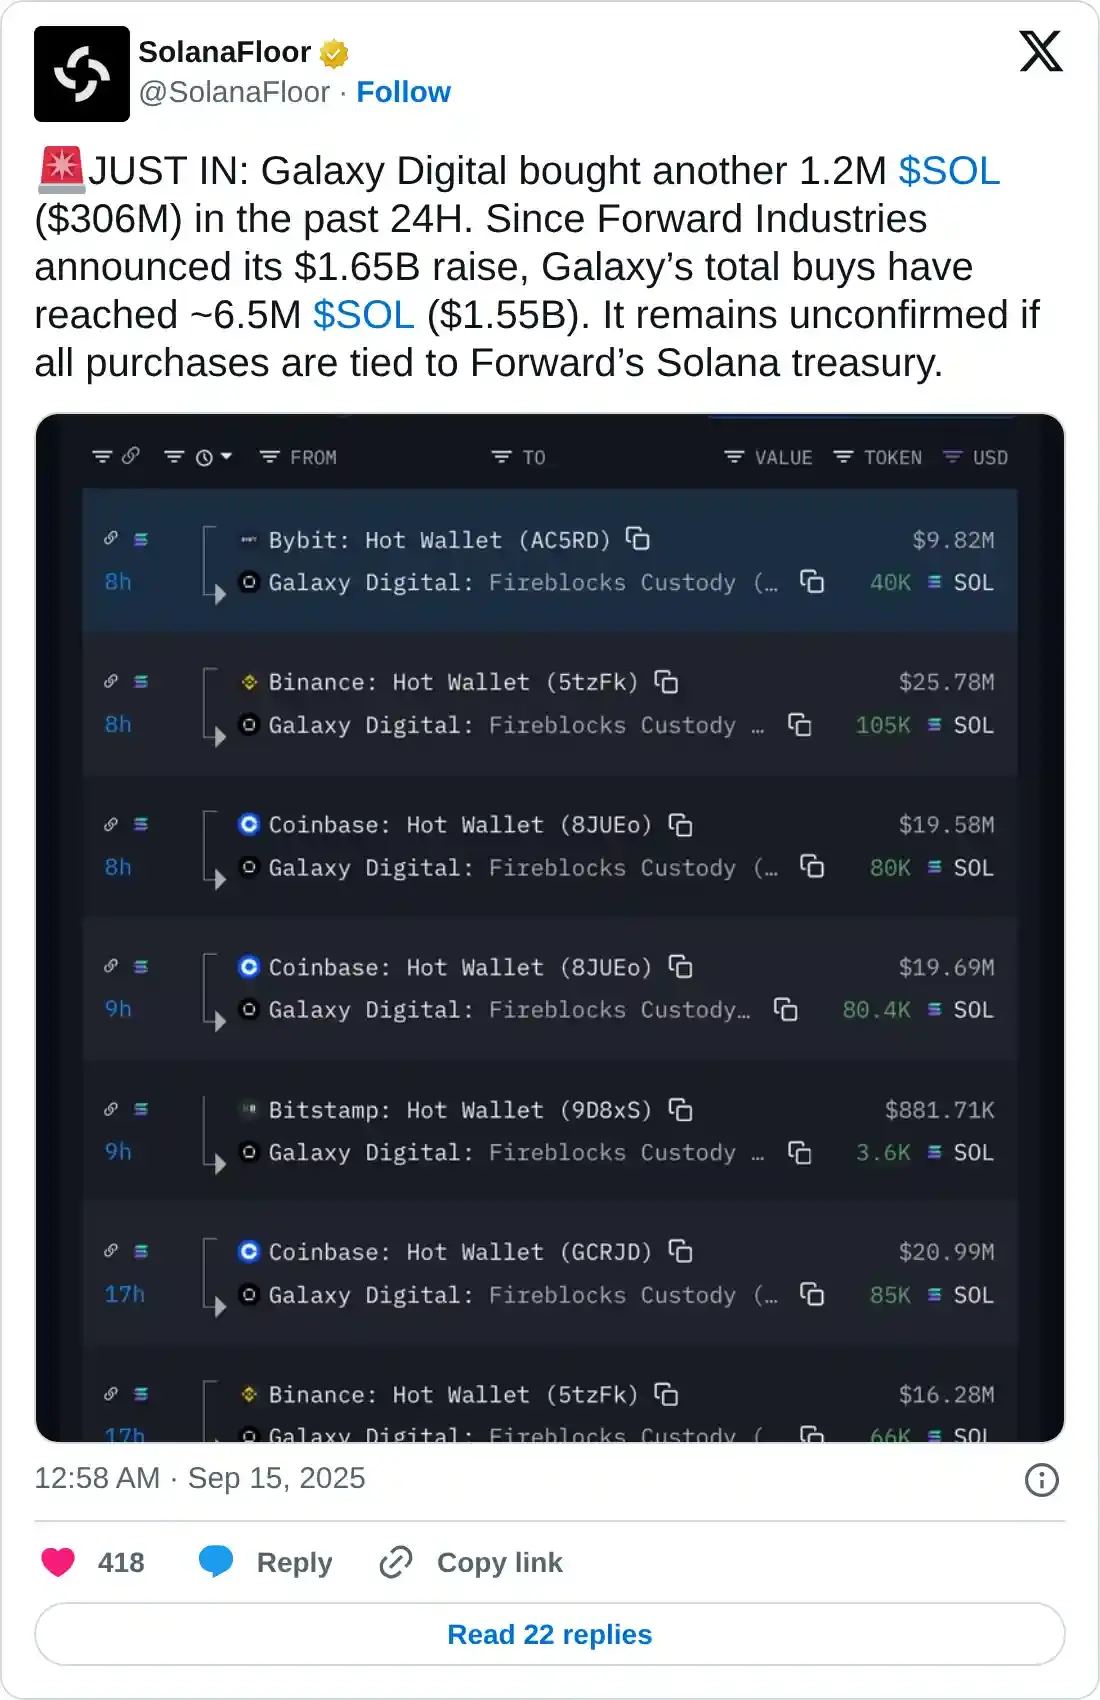
Moreover, SolanaFloor data indicate that Galaxy Digital purchased an additional 1.2 million SOL tokens, valued at $306 million, over the past 24 hours. Since Forward Industries announced its $1.65 billion raise on Thursday, Galaxy’s total buys have reached nearly 6.5 million SOL, valued at $1.55 billion. It remains unconfirmed if all purchases are tied to Forward’s Solana treasury.
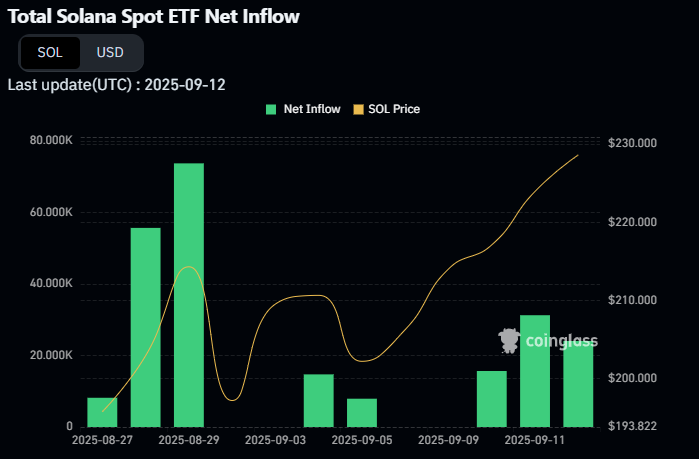
Looking at the total Solana spot Exchange Traded Funds (ETFs) from Rex-Osprey SOL + Staking ETF (SSK), have recorded an inflow of $15.90 million last week, supporting the bullish view.
Solana Price Forecast: Bulls aiming for record highs
Solana price broke above the upper trendline of a parallel channel (drawn by joining multiple highs and lows since mid-April) on Thursday and rallied by nearly 6% over the next two days. At the time of writing on Monday, it trades at around $242.85.
If SOL continues its upward momentum, it could extend the rally toward its record high of $295.83.
The Relative Strength Index (RSI) on the daily chart reads 69, nearing its overbought levels of 70, and points upward, indicating strong bullish momentum. The Moving Average Convergence Divergence (MACD) also showed a bullish crossover last week, which remains in effect, indicating sustained bullish momentum and an upward trend ahead.

SOL/USDT daily chart
However, if SOL faces a correction, it could extend the decline toward its daily support at $230.
