Bitcoin Price Fails to Recover – Is a Massive Crash Looming?

Bitcoin's rebound hits a wall—traders brace for potential freefall as momentum stalls.
Technical Breakdown
Key support levels crumble under sustained selling pressure. The charts paint a grim picture with each failed recovery attempt digging a deeper hole. Resistance holds firm like a brick wall—every minor bounce gets smothered by aggressive profit-taking.
Market Sentiment Shift
Fear spreads faster than a blockchain fork. Whispers of 'bigger crash' dominate trading desks as institutional players hedge their bets. Retail investors panic-sell while whales accumulate quietly—classic market psychology playing out in real-time.
Regulatory Shadows
Uncertainty breeds volatility. Regulatory chatter from major economies adds fuel to the fire—because nothing screams stability like politicians suddenly discovering crypto exists after a 20% drop.
Bottom Line: This isn't a dip—it's a stress test. Either Bitcoin proves its resilience or confirms the bears' favorite narrative. Either way, someone's getting rekt while traditional finance guys smirk about 'told you so' moments over their overpriced coffee.
Bitcoin Price Attempts Fresh Increase
Bitcoin price extended losses after close below the $112,000 level. BTC gained bearish momentum and traded below the $111,500 support zone.
There was a MOVE below the $110,500 support zone and the 100 hourly Simple moving average. The pair tested the $108,750 zone. A low was formed at $108,734 and the price recently started a recovery wave. There was a move above the $112,000 level.
The price surpassed the 23.6% Fib retracement level of the key drop from the $117,354 swing high to the $110,734 low. Besides, there was a break above a key bearish trend line with resistance at $111,350 on the hourly chart of the BTC/USD pair.
Bitcoin is now trading below $112,500 and the 100 hourly Simple moving average. Immediate resistance on the upside is NEAR the $112,500 level. The first key resistance is near the $113,000 level or the 50% Fib retracement level of the key drop from the $117,354 swing high to the $110,734 low. The next resistance could be $114,000.
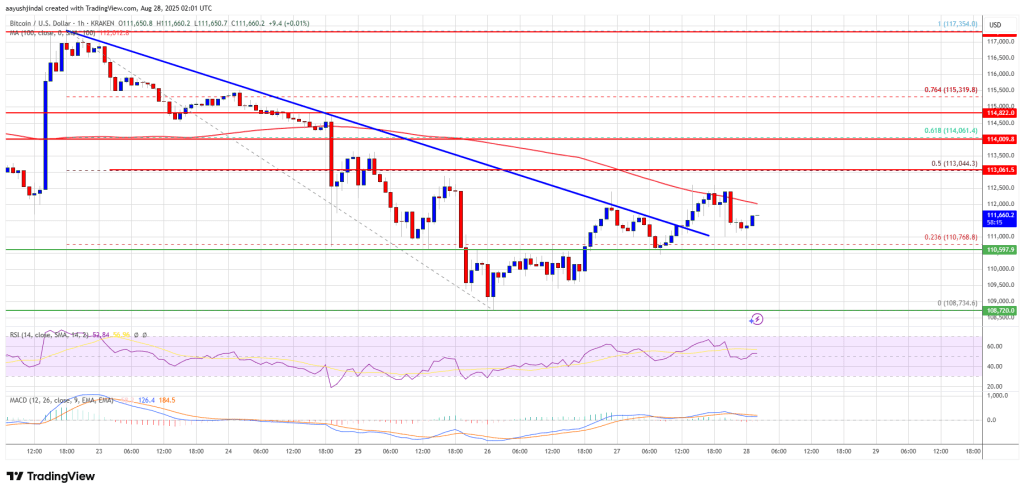
A close above the $114,000 resistance might send the price further higher. In the stated case, the price could rise and test the $115,000 resistance level. Any more gains might send the price toward the $115,500 level. The main target could be $116,500.
Another Decline In BTC?
If Bitcoin fails to rise above the $113,000 resistance zone, it could start a fresh decline. Immediate support is near the $110,600 level. The first major support is near the $109,500 level.
The next support is now near the $108,750 zone. Any more losses might send the price toward the $107,100 support in the near term. The main support sits at $105,500, below which BTC might accelerate lower.
Technical indicators:
Hourly MACD – The MACD is now losing pace in the bearish zone.
Hourly RSI (Relative Strength Index) – The RSI for BTC/USD is now below the 50 level.
Major Support Levels – $110,600, followed by $109,500.
Major Resistance Levels – $112,500 and $113,000.
