Dogecoin (DOGE) Defies Gravity—Will the Memecoin Rally or Plummet in 2025?

Dogecoin's latest price action has traders split—bulls see a rocket, bears see a falling knife.
Can the OG memecoin dodge a crypto winter?
While Bitcoin ETFs grab headlines, DOGE whales are placing big bets. The coin's 30-day volatility now rivals most altcoins—fueling both breakout hopes and dump fears.
Technical indicators flash mixed signals: RSI teeters near oversold while the 50-day MA plays tug-of-war with resistance. Retail FOMO could trigger a squeeze… or become exit liquidity for savvy traders.
One thing's certain—when DOGE moves, it doesn't do subtle. Whether that means +200% or -60% next? Even 'financial experts' pushing TA on TikTok won't pretend to know.
(Though let's be real—if Wall Street could meme this well, they'd have replaced the Fed with an Elon tweet generator by now.)
Dogecoin Price Dips Again
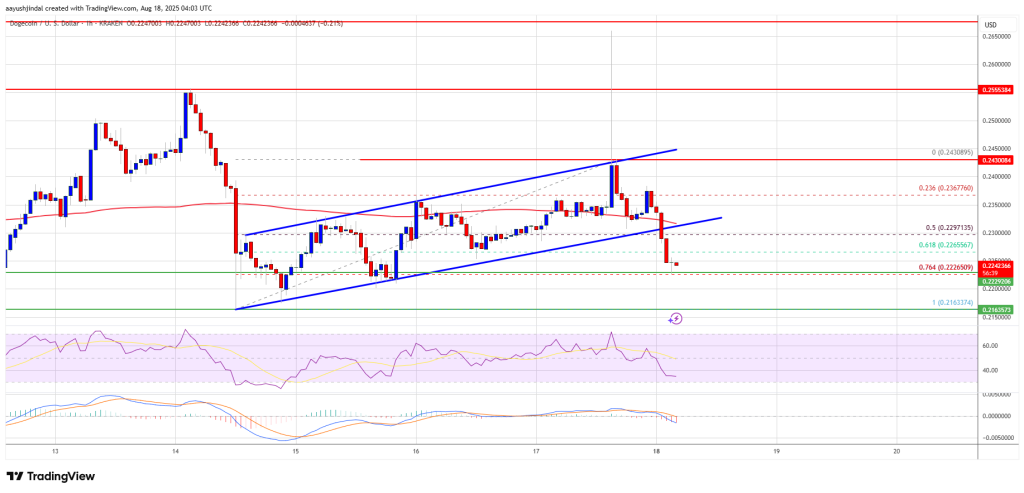
Dogecoin price started a fresh increase above the $0.240 resistance zone, like Bitcoin and Ethereum. DOGE even spiked above $0.2420 before the bears appeared.
A high was formed at $0.2430 and the price started a fresh decline. There was a MOVE below the $0.240 and $0.2350 levels. The price dipped below the 50% Fib retracement level of the upward move from the $0.2163 swing low to the $0.2430 high.
Besides, there was a break below a key rising channel with support at $0.2295 on the hourly chart of the DOGE/USD pair. Dogecoin price is now trading below the $0.2320 level and the 100-hourly simple moving average.
The bulls are now protecting the 76.4% Fib retracement level of the upward move from the $0.2163 swing low to the $0.2430 high. If there is a recovery wave, immediate resistance on the upside is NEAR the $0.2295 level. The first major resistance for the bulls could be near the $0.2320 level.
The next major resistance is near the $0.2420 level. A close above the $0.2420 resistance might send the price toward the $0.250 resistance. Any more gains might send the price toward the $0.2650 level. The next major stop for the bulls might be $0.2780.
More Losses In DOGE?
If DOGE’s price fails to climb above the $0.2320 level, it could continue to move down. Initial support on the downside is near the $0.2220 level. The next major support is near the $0.2165 level.
The main support sits at $0.2150. If there is a downside break below the $0.2150 support, the price could decline further. In the stated case, the price might decline toward the $0.2050 level or even $0.2020 in the near term.
Technical Indicators
Hourly MACD – The MACD for DOGE/USD is now gaining momentum in the bearish zone.
Hourly RSI (Relative Strength Index) – The RSI for DOGE/USD is now below the 50 level.
Major Support Levels – $0.2165 and $0.2150.
Major Resistance Levels – $0.2320 and $0.2420.
