XRP Bears Force Retreat—Can Bulls Defend the $3 Fortress in 2025?

XRP's bull run faces its toughest test yet as bears claw toward critical support. The $3 level isn't just psychological—it's the battleground where the next market phase gets decided.
Bulls vs. Bears: Who Blinks First?
Every trader's chart lights up with the same question: Will the bull flag hold or fold? With volatility spiking, XRP's price action resembles a high-frequency trader on triple espresso.
The Institutional Wildcard
Hedge funds quietly accumulate while retail traders panic-sell—because nothing screams 'market bottom' like Wall Street sharks circling drained portfolios. Meanwhile, crypto Twitter alternates between 'generational buying opportunity' and 'imminent collapse' takes.
Technical Breakdown
The $3 support zone isn't just a number—it's the make-or-break level where liquidity pools cluster like bankers at a private jet auction. Break below? Prepare for cascading liquidations. Hold? The path to $5 clears faster than a VIP crypto conference bar.
Regulatory Swordplay
SEC lawsuits loom like expired options contracts—everyone knows they're coming, but nobody agrees on the strike price. XRP's legal limbo adds more uncertainty than a 'stablecoin' backed by a founder's pinky swear.
Final Takedown: Either we're witnessing the mother of all bull traps, or the last chance to board before the real rocket launch. As always in crypto—flip a coin (unless the SEC claims it's a security).
XRP Price Dips Further
XRP price attempted more gains above the $3.250 zone, like Bitcoin and Ethereum. The price failed to extend gains and started a downside correction below the $3.150 level.
The pair dipped below the $3.120 and $3.10 support levels. Finally, it tested the $3.00 support zone. A low was formed at $2.971 and the price is now showing bearish signs below the 23.6% Fib retracement level of the downward MOVE from the $3.350 swing high to the $2.97 low.
The price is now trading below $3.050 and the 100-hourly Simple Moving Average. On the upside, the price might face resistance near the $3.020 level. The first major resistance is near the $3.050 level. There is also a bearish trend line forming with resistance at $3.060 on the hourly chart of the XRP/USD pair.
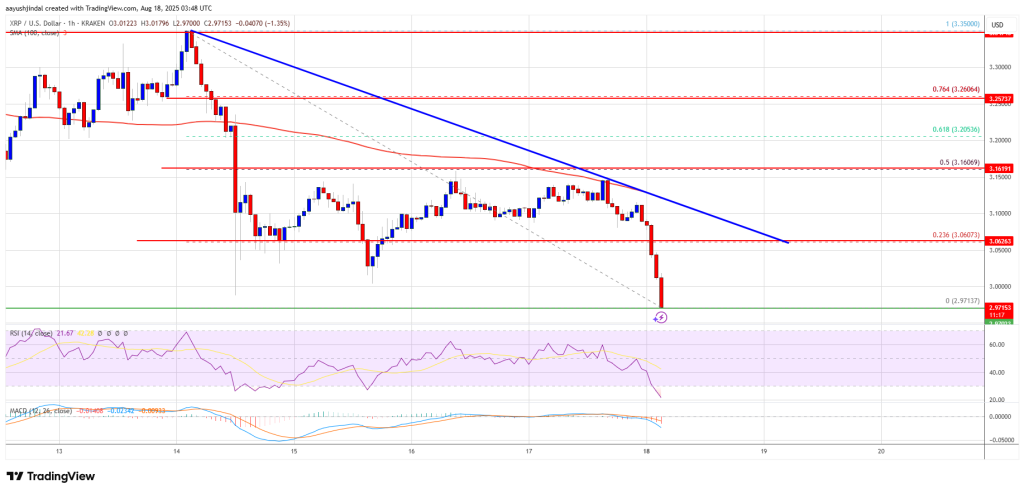
A clear move above the $3.060 resistance might send the price toward the $3.120 resistance. Any more gains might send the price toward the $3.150 resistance or the 50% Fib retracement level of the downward move from the $3.350 swing high to the $2.97 low. The next major hurdle for the bulls might be near $3.20.
More Losses?
If XRP fails to clear the $3.050 resistance zone, it could start a fresh decline. Initial support on the downside is near the $2.9650 level. The next major support is near the $2.920 level.
If there is a downside break and a close below the $2.920 level, the price might continue to decline toward the $2.850 support. The next major support sits near the $2.80 zone, below which there could be a larger decline.
Technical Indicators
Hourly MACD – The MACD for XRP/USD is now gaining pace in the bearish zone.
Hourly RSI (Relative Strength Index) – The RSI for XRP/USD is now below the 50 level.
Major Support Levels – $2.920 and $2.850.
Major Resistance Levels – $3.050 and $3.150.
