Bitcoin Dips 4% Post-Rally: Temporary Pullback or Start of a Deeper Correction?

Bitcoin bulls hit pause as BTC sheds 4% after a blistering rally—classic profit-taking or warning signs ahead?
Market jitters or healthy reset? The king of crypto takes a breather, leaving traders debating whether this is a buying opportunity or the calm before another storm.
Meanwhile, Wall Street 'experts' scramble to update their price targets—because nothing says credibility like revising predictions after the fact.
Bitcoin Price Dips Sharply
Bitcoin price traded to a new all-time high NEAR $124,000 before the bears appeared. BTC started a correction and traded below the $122,000 support zone.
There was a MOVE below the $121,200 support zone and the 100 hourly Simple moving average. Besides, there was a break below a key bullish trend line with support at $120,000 on the hourly chart of the BTC/USD pair. The pair tested the $117,250 zone.
It is now consolidating losses and has recovered some losses to test the 23.6% Fib retracement level of the move from the $124,420 swing high to the $117,250 low. Bitcoin is now trading below $120,000 and the 100 hourly Simple moving average.
Immediate resistance on the upside is near the $119,000 level. The first key resistance is near the $120,000 level. The next resistance could be $120,500. A close above the $120,500 resistance might send the price further higher.
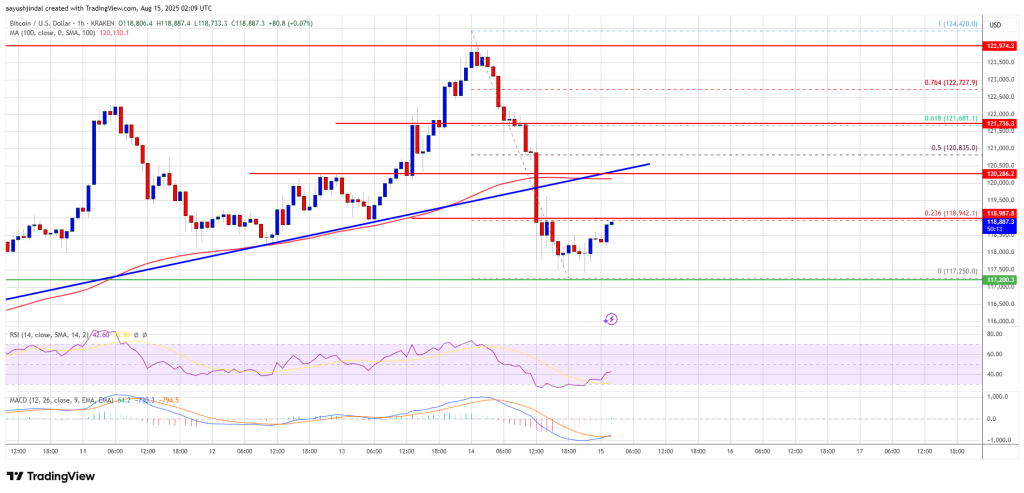
In the stated case, the price could rise and test the $121,650 resistance level or the 61.8% Fib retracement level of the move from the $124,420 swing high to the $117,250 low. Any more gains might send the price toward the $122,200 level. The main target could be $123,500.
Another Decline In BTC?
If bitcoin fails to rise above the $120,000 resistance zone, it could start a fresh decline. Immediate support is near the $118,000 level. The first major support is near the $117,250 level.
The next support is now near the $116,500 zone. Any more losses might send the price toward the $115,500 support in the near term. The main support sits at $113,500, below which BTC might continue to move down.
Technical indicators:
Hourly MACD – The MACD is now losing pace in the bullish zone.
Hourly RSI (Relative Strength Index) – The RSI for BTC/USD is now below the 50 level.
Major Support Levels – $117,250, followed by $116,500.
Major Resistance Levels – $120,000 and $120,500.
