Ethereum’s 2025 Fractal Echoes Bitcoin’s Historic 2018-2021 Rally—1,110% Breakout Imminent?

History doesn’t repeat, but it sure rhymes. Ethereum’s price action is mirroring Bitcoin’s explosive 2018-2021 trajectory—and the charts suggest a potential 1,110% surge is brewing.
### The Fractal Blueprint
Same consolidation pattern. Same bullish divergence. Same institutional FOMO lurking in the shadows. ETH’s current setup is a carbon copy of BTC’s pre-parabolic phase—back when skeptics called it a ‘dead cat bounce’ right before it mooned.
### Liquidity Awaits
Market makers are eyeing the $3K zone as a springboard. Break that, and the algorithm-driven whales start stacking contracts faster than a hedge fund manager chasing performance fees.
### The Cynic’s Corner
Sure, Wall Street will claim they ‘always believed in Web3’—just like they ‘always understood Bitcoin’ after the 20,000% pump. Funny how price charts convert skeptics into evangelists.
Buckle up. This isn’t hopium—it’s fractal mathematics meeting market psychology. And ETH’s equation spells ‘volatility ahead.’
Ethereum Fractal Structure Signals 1,110% Rally
According to technical analysis of Ethereum’s price action on the weekly candlestick timeframe chart, the leading altcoin is about to enter into a 1,110% rally that might take its price above $20,000. This analysis was initially noted by crypto analyst Merlijn The Trader, who identified a repeating cycle that closely aligns Ethereum’s current performance with Bitcoin’s 2018-2021 run.
Taking to the social media platform X, the analyst noted that in that earlier cycle, bitcoin endured an 83% drop from its highs before staging a powerful 342% recovery. This was followed by a secondary correction of around 63%, which ultimately served as the base for a 1,110% surge between the second half of 2020 and the first half of 2021.
Ethereum’s weekly chart has been following the same sequence almost step-for-step in the past few years. After a steep 83% decline from its 2021 peak, ethereum mounted a 342% rebound, only to experience a deep retracement of roughly 63% to $1,500 in April 2025. Since then, however, Ethereum has mounted another rebound, with the latest move being the most recent rally back above $4,200.
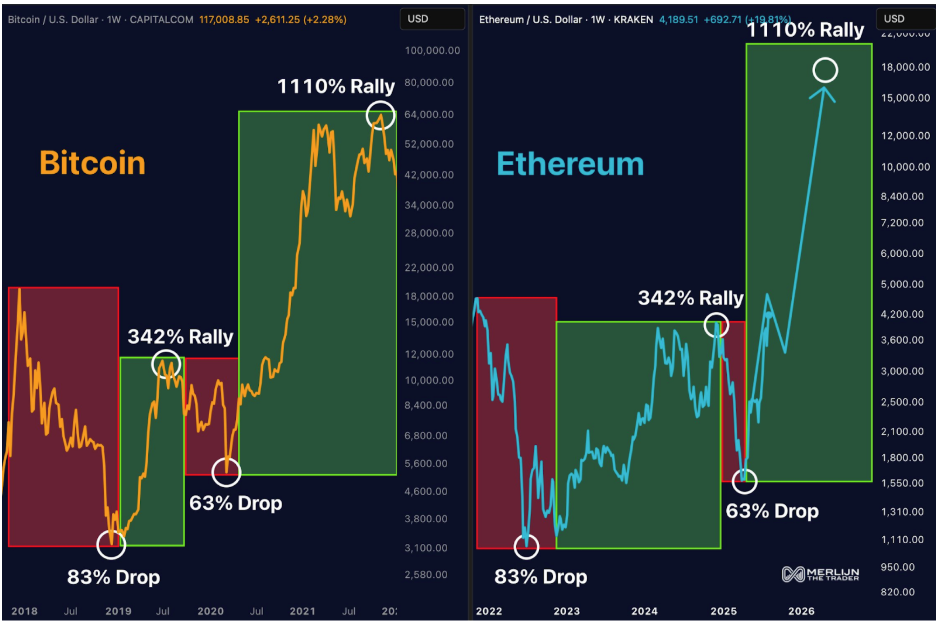
Image From X: Merlijn The Trader
This latest rally shows Ethereum is now in the final phase, where it could be positioned for a comparable explosive run to as high as $20,000 if the fractal continues to play out.
In another analysis, Merlijn The Trader also pointed out that Ethereum’s weekly chart is echoing its own 2017 breakout structure. In that cycle, Ethereum reclaimed the 50-week moving average after a prolonged consolidation phase before entering into a sustained and powerful rally. The 2025 chart shows a similar reclaim of the 50 MA, and the price is now breaking above the $4,000 resistance zone that has stood since March 2024.
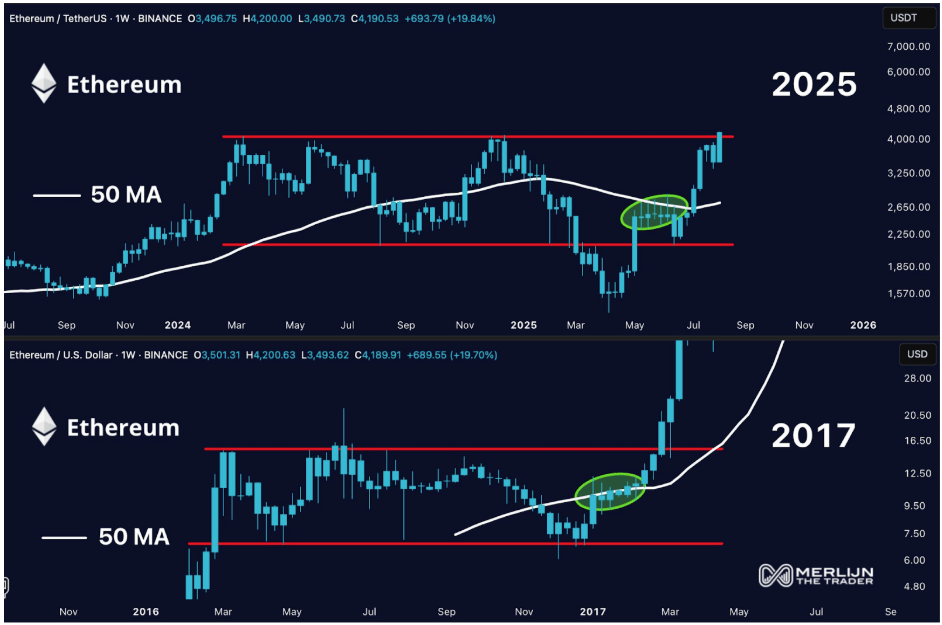
Image From X: Merlijn The Trader
Bullish Sentiment Building Above $4,000
Although Ethereum’s recent price rally can be mostly attributed to institutional buys in Spot Ethereum ETFs, the breakout above $4,000 has not gone unnoticed in the broader market. Notably, data from on-chain analytics platform Santiment reflects a dramatic rise in bullish activity across social channels.
Mentions tied to buying, optimism, and higher price expectations have surged sharply, now outpacing bearish commentary such as selling or lower price calls by almost two-to-one. Although this can create the conditions in which Ethereum’s rally can sustain momentum, too much FOMO can also put a temporary halt to any rally.
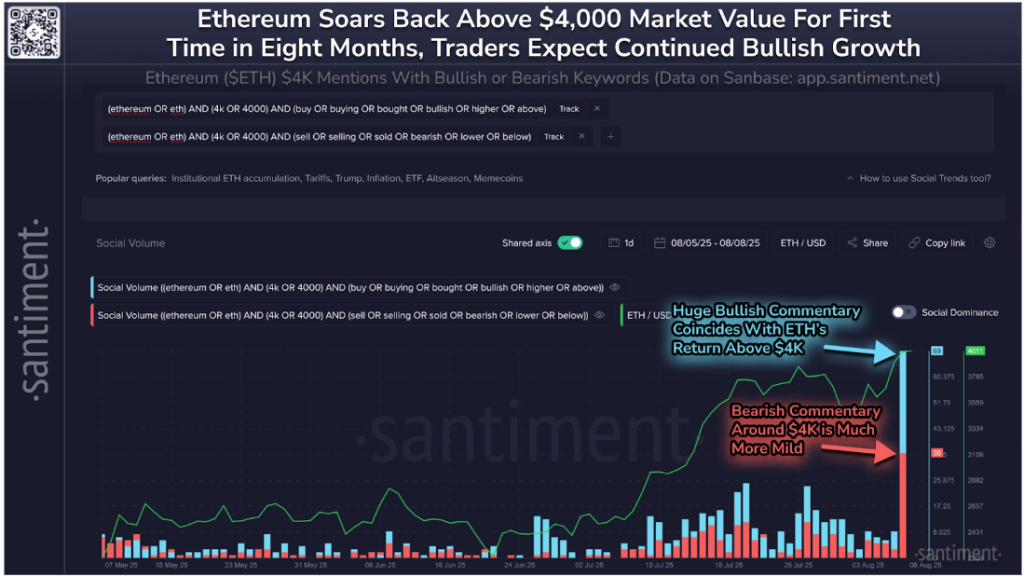
Image From X: Santiment
At the time of writing, Ethereum is trading at $4,225, up by 23% in the past seven days.
Featured image from Unsplash, chart from TradingView
