Solana (SOL) Primed for Breakout – Will It Smash Through This Critical Resistance?

Solana bulls are revving their engines as SOL tests a make-or-break level. The high-speed blockchain’s token has been flirting with a key resistance zone – and traders are watching for the next explosive move.
Can SOL finally punch through?
The smart money’s betting on volatility. With institutional interest creeping back into crypto (despite Wall Street’s usual ‘this time it’s different’ skepticism), Solana’s developer activity and NFT volume suggest more than just speculative froth. The chain keeps eating Ethereum’s lunch in raw throughput – though VCs still can’t decide if it’s ‘the next ETH killer’ or just a well-oiled meme machine.
Watch the order books. A clean breakout could trigger algorithmic buying frenzies, while rejection here might see SOL retest support levels. Either way – buckle up. In crypto, even ‘stable’ coins need dramamine.
Solana Price Eyes Upside Break
Solana price started a decent increase after it found support near the $162 zone, like Bitcoin and Ethereum. SOL climbed above the $165 level to enter a short-term positive zone.
The price even smashed the $1682 resistance. The bulls were able to push the price above the 50% Fib retracement level of the downward move from the $172 swing high to the $162 low. However, the bears are active NEAR the $170 zone.
The 76.4% Fib retracement level of the downward MOVE from the $172 swing high to the $162 low is acting as a resistance. There is also a contracting triangle forming with resistance at $168 on the hourly chart of the SOL/USD pair.
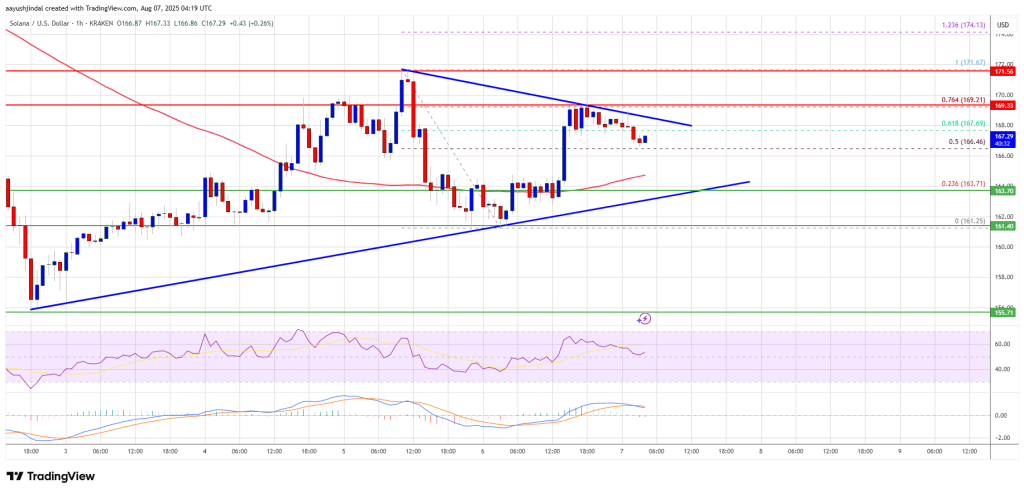
Solana is now trading above $165 and the 100-hourly simple moving average. On the upside, the price is facing resistance near the $170 level. The next major resistance is near the $172 level. The main resistance could be $175. A successful close above the $175 resistance zone could set the pace for another steady increase. The next key resistance is $182. Any more gains might send the price toward the $192 level.
Are Downsides Limited In SOL?
If SOL fails to rise above the $170 resistance, it could start another decline. Initial support on the downside is near the $164 zone. The first major support is near the $162 level.
A break below the $162 level might send the price toward the $152 support zone. If there is a close below the $150 support, the price could decline toward the $145 support in the near term.
Technical Indicators
Hourly MACD – The MACD for SOL/USD is losing pace in the bullish zone.
Hourly Hours RSI (Relative Strength Index) – The RSI for SOL/USD is above the 50 level.
Major Support Levels – $164 and $162.
Major Resistance Levels – $170 and $172.
