XRP Price Stalls Below Key Resistance – Are Bulls Losing Momentum?

XRP's rally hits a wall—again. The digital asset can't seem to break through stubborn resistance levels, leaving traders wondering if the bullish momentum is fading.
Key resistance holds firm. Despite multiple attempts, XRP remains trapped below a critical price ceiling, testing the patience of even the most optimistic holders.
Volume tells the story. Thin trading activity suggests fading conviction—no whale-sized bets signaling a breakout. Meanwhile, Bitcoin ETFs get all the headlines (and the inflows).
What's next? If bulls can't force a breakout soon, expect sideways action—or worse, a retreat to lower support. Classic crypto: hurry up and wait.
XRP Price Faces Resistance
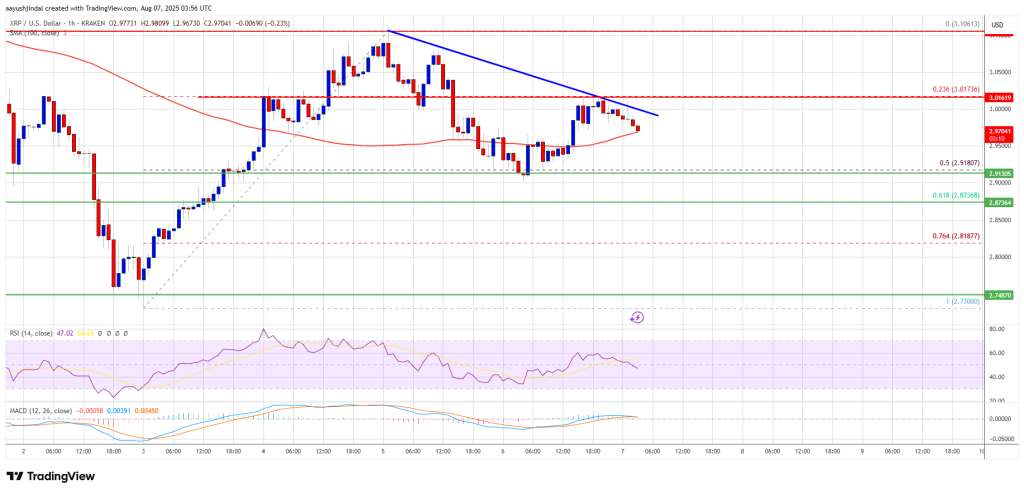
XRP price failed to continue higher above the $3.10 resistance zone, like Bitcoin and Ethereum. The price formed a short-term top and started a fresh decline below the $3.020 level.
The price dipped below the $3.00 level. There was a move below $2.950 and the price tested the 50% Fib retracement level of the upward move from the $2.730 swing low to the $3.106 high. However, the bulls were active NEAR the $2.920 zone.
The price is now trading near $2.980 and the 100-hourly Simple Moving Average. On the upside, the price might face resistance near the $3.00 level. There is also a bearish trend line forming with resistance at $3.020 on the hourly chart of the XRP/USD pair.
The first major resistance is near the $3.10 level. A clear MOVE above the $3.10 resistance might send the price toward the $3.120 resistance. Any more gains might send the price toward the $3.180 resistance or even $3.20 in the near term. The next major hurdle for the bulls might be near the $3.250 zone.
Another Decline?
If XRP fails to clear the $3.020 resistance zone, it could start another decline. Initial support on the downside is near the $2.920 level. The next major support is near the $2.880 level or the 61.8% Fib retracement level of the upward move from the $2.730 swing low to the $3.106 high.
If there is a downside break and a close below the $2.880 level, the price might continue to decline toward the $2.810 support. The next major support sits near the $2.750 zone where the bulls might take a stand.
Technical Indicators
Hourly MACD – The MACD for XRP/USD is now losing pace in the bearish zone.
Hourly RSI (Relative Strength Index) – The RSI for XRP/USD is now below the 50 level.
Major Support Levels – $2.920 and $2.880.
Major Resistance Levels – $3.020 and $3.10.
