Bitcoin Bulls Charge Again – Short-Term Rally Targets New Highs

Bitcoin's price is flexing its muscles once more, with bulls pushing for a decisive breakout. After weeks of sideways action, the crypto king shows signs of life—just as Wall Street traders start their summer vacations.
The Setup:
Key resistance levels are being tested, and liquidity pools are primed. This isn't just a dead-cat bounce—it's a coordinated assault on short positions.
The Play:
Watch for a clean break above $XX,XXX (because apparently, round numbers still matter in decentralized finance). If momentum holds, we could see a classic 'short squeeze'—those overleveraged hedge funds love getting steamrolled by retail traders.
The Catch:
Volume remains suspiciously light. As always in crypto, the 'rally' might just be one whale's lunch money moving between wallets. But for now? The charts say 'risk on.' Just don't tell the SEC.
Bitcoin Price Attempts Recovery
Bitcoin price found support NEAR the $112,000 zone and started a recovery wave. BTC was able to climb above the $113,500 and $114,200 resistance levels.
Besides, there was a break above a bearish trend line with resistance at $114,300 on the hourly chart of the BTC/USD pair. The price climbed toward the 50% Fib retracement level of the MOVE from the $118,918 swing high to the $112,000 low.
However, the bears were active near the $115,500 resistance and the price struggled to continue higher. Bitcoin is now trading above $114,000 and the 100 hourly Simple moving average.
Immediate resistance on the upside is near the $115,000 level. The first key resistance is near the $115,500 level. The next resistance could be $116,250 or the 61.8% Fib retracement level of the move from the $118,918 swing high to the $112,000 low.
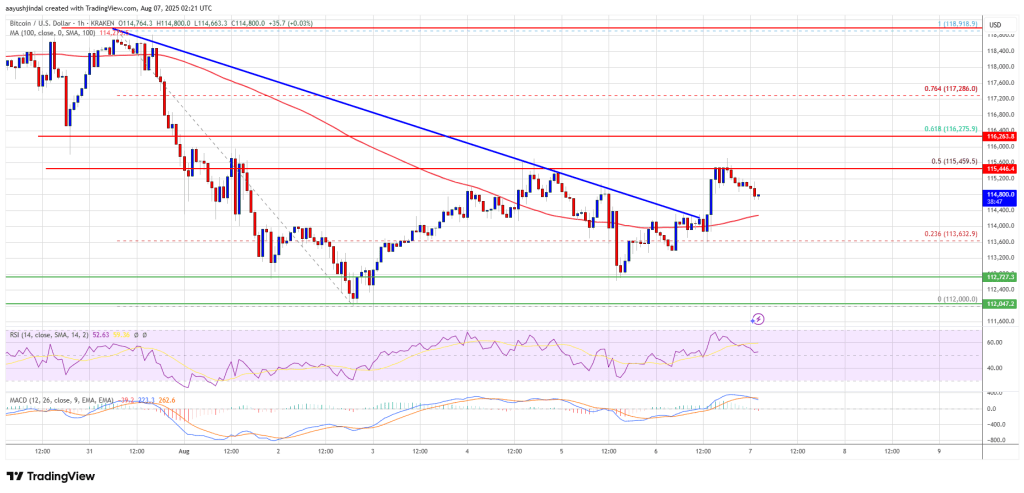
A close above the $116,250 resistance might send the price further higher. In the stated case, the price could rise and test the $117,500 resistance level. Any more gains might send the price toward the $118,000 level. The main target could be $120,000.
Another Drop In BTC?
If bitcoin fails to rise above the $115,500 resistance zone, it could start another decline. Immediate support is near the $114,200 level. The first major support is near the $113,500 level.
The next support is now near the $112,000 zone. Any more losses might send the price toward the $110,500 support in the near term. The main support sits at $108,500, below which BTC might continue to move down.
Technical indicators:
Hourly MACD – The MACD is now losing pace in the bearish zone.
Hourly RSI (Relative Strength Index) – The RSI for BTC/USD is now above the 50 level.
Major Support Levels – $113,500, followed by $112,000.
Major Resistance Levels – $115,500 and $117,500.

Log in to Reply
Log in to comment your thoughtsComments
Related Articles
|Square
Get the BTCC app to start your crypto journey
Get started today Scan to join our 100M+ users