Bitcoin Teeters Under Key Resistance – Is a Sharp Correction Looming?

Bitcoin’s price action is giving traders déjà vu—another struggle below resistance, another whisper of downside risk. The king of crypto can’t seem to muster the momentum to break through, and the charts are flashing warning signs.
Will history repeat with a brutal rejection? Or is this just another fakeout before the next leg up? Let’s cut through the noise.
The Resistance Battle:
Price keeps tapping against a stubborn ceiling, each failed attempt chipping away at bullish conviction. Traders are eyeing the order books like hawks—liquidity pools just above could either fuel a breakout or trigger a cascade of stop-losses.
The Bull Case:
Macro tailwinds haven’t vanished. Institutional demand simmers, and the halving’s supply crunch still looms. If BTC holds here, it’s coiled for a violent move north.
The Bear Trap:
But let’s be real—Wall Street’s ‘adoption’ narrative hasn’t stopped them from shorting retail into oblivion. A drop below support could spark panic selling, especially with leverage stacked to the skies.
One thing’s certain: volatility is back on the menu. Whether you’re loading up or bracing for impact, keep your exits closer than your banker’s moral compass.
Bitcoin Price Faces Resistance
Bitcoin price found support NEAR the $112,000 zone and started a recovery wave. BTC was able to climb above the $113,200 and $114,000 resistance levels.
The price climbed above the 23.6% Fib retracement level of the downward MOVE from the $118,918 swing high to the $112,000 low. However, the bears were active near the $115,500 resistance and the price struggled to continue higher.
The 50% Fib retracement level of the downward move from the $118,918 swing high to the $112,000 low acted as a resistance. Bitcoin is now trading below $114,000 and the 100 hourly Simple moving average. There is also a bearish trend line forming with resistance at $114,400 on the hourly chart of the BTC/USD pair.
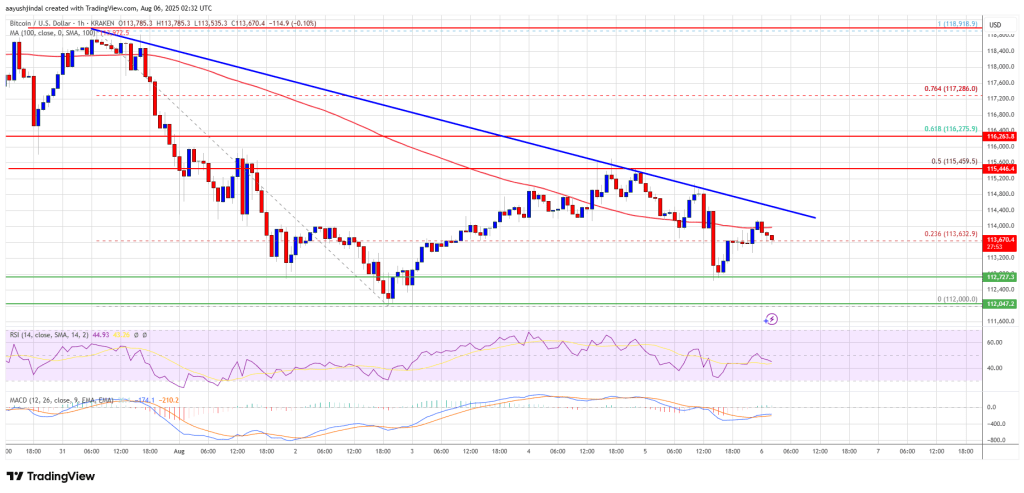
Immediate resistance on the upside is near the $114,000 level. The first key resistance is near the $115,000 level. The next resistance could be $115,500. A close above the $115,500 resistance might send the price further higher. In the stated case, the price could rise and test the $116,500 resistance level. Any more gains might send the price toward the $118,000 level. The main target could be $120,000.
Another Decline In BTC?
If bitcoin fails to rise above the $115,000 resistance zone, it could start another decline. Immediate support is near the $113,200 level. The first major support is near the $112,500 level.
The next support is now near the $112,000 zone. Any more losses might send the price toward the $110,500 support in the near term. The main support sits at $108,500, below which BTC might continue to move down.
Technical indicators:
Hourly MACD – The MACD is now gaining pace in the bearish zone.
Hourly RSI (Relative Strength Index) – The RSI for BTC/USD is now below the 50 level.
Major Support Levels – $112,600, followed by $112,000.
Major Resistance Levels – $115,000 and $115,500.
