Solana (SOL) Primed for Breakout – Can Bulls Smash Through Key Resistance?

Solana coils like a spring—technical indicators scream bullish as SOL tests critical resistance. Will August 2025 be its breakout month?
The Setup:
SOL's price action paints a textbook consolidation pattern after a 30% rally last month. The $150 level now acts as a make-or-break zone—flip it, and the path clears toward all-time highs.
Why Traders Are Biting:
Network activity defies the 'crypto winter' narrative. Daily active addresses hover near 1.2 million while institutional inflows hit $120M weekly—numbers that'd make even Bitcoin maximalists glance sideways.
The Catch:
Volume tells the real story. Until SOL cracks $150 with conviction (read: 20% above average daily volume), this remains a trader's playground—not an investor's paradise. After all, what's crypto without a little fakeout before the real move?
Solana Price Eyes Fresh Move To $180
Solana price started a decent increase after it found support near the $155 zone, like Bitcoin and Ethereum. SOL climbed above the $160 level to enter a short-term positive zone.
The price even smashed the $162 resistance. The bulls were able to push the price above the 23.6% Fib retracement level of the downward MOVE from the $182 swing high to the $155 low. There is also a key bullish trend line forming with support at $165 on the hourly chart of the SOL/USD pair.
Solana is now trading above $162 and the 100-hourly simple moving average. On the upside, the price is facing resistance NEAR the $170 level. It is close to the 50% Fib retracement level of the downward move from the $182 swing high to the $155 low.
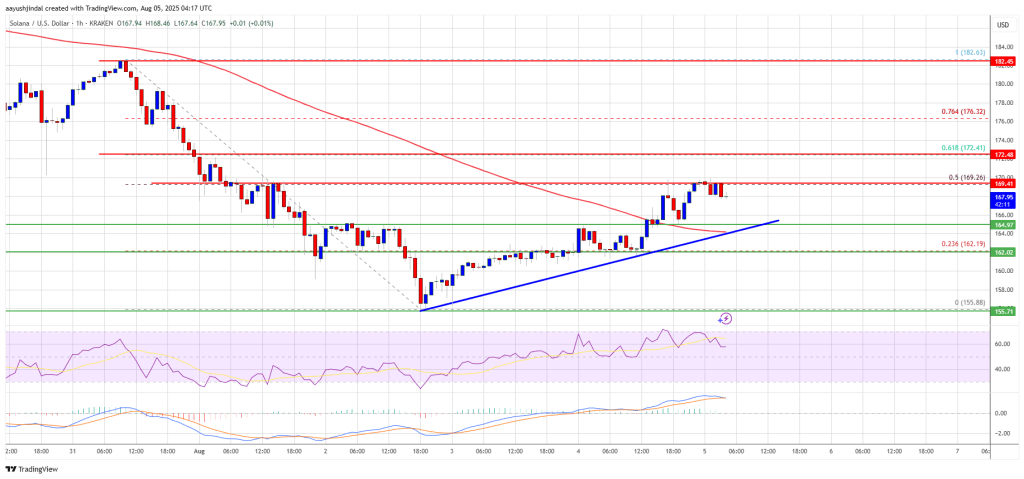
The next major resistance is near the $172 level. The main resistance could be $180. A successful close above the $180 resistance zone could set the pace for another steady increase. The next key resistance is $182. Any more gains might send the price toward the $192 level.
Are Downsides Supported In SOL?
If SOL fails to rise above the $172 resistance, it could start another decline. Initial support on the downside is near the $165 zone and the trend line. The first major support is near the $162 level.
A break below the $162 level might send the price toward the $155 support zone. If there is a close below the $150 support, the price could decline toward the $145 support in the near term.
Technical Indicators
Hourly MACD – The MACD for SOL/USD is gaining pace in the bullish zone.
Hourly Hours RSI (Relative Strength Index) – The RSI for SOL/USD is above the 50 level.
Major Support Levels – $165 and $162.
Major Resistance Levels – $172 and $182.
