Bitcoin Roars Back: Is This the Start of a Parabolic Rally?

Bitcoin's bulls are back in charge—price action surges as traders eye a potential breakout.
After weeks of sideways grinding, BTC slashes through resistance levels like a hot knife through butter. The $40K psychological barrier? Toasted. Short sellers? Getting squeezed harder than a Wall Street intern during earnings season.
The fuel behind the fire:
- Spot ETF inflows hitting 3-month highs
- Miner capitulation reversing
- Macro winds shifting as dollar strength ebbs
Watch these key levels:
A clean hold above $42,500 opens the path to retest all-time highs. But watch that RSI—when crypto traders start yelling 'oversold' and 'overbought' in the same week, you know volatility's coming.
Meanwhile, traditional finance guys are still trying to short BTC with 5x leverage while paying 8% interest—some lessons get learned the expensive way.
This isn't just a dead cat bounce. It's a market waking up to the reality that fiat keeps devaluing while Bitcoin's code stays harder than a banker's heart.
Bitcoin Price Eyes Upside Break
Bitcoin price started a downward MOVE from the $118,000 zone. BTC declined below the $115,000 and $113,500 support levels to enter a short-term bearish zone.
The price tested the $112,000 zone. A base was formed and the price is now attempting to recover. There was a move above the $113,500 and $114,200 levels. The price surpassed the 23.6% Fib retracement level of the downward move from the $118,918 swing high to the $112,000 low.
Bitcoin is now trading above $114,200 and the 100 hourly Simple moving average. There is also a bullish trend line forming with support at $114,600 on the hourly chart of the BTC/USD pair.
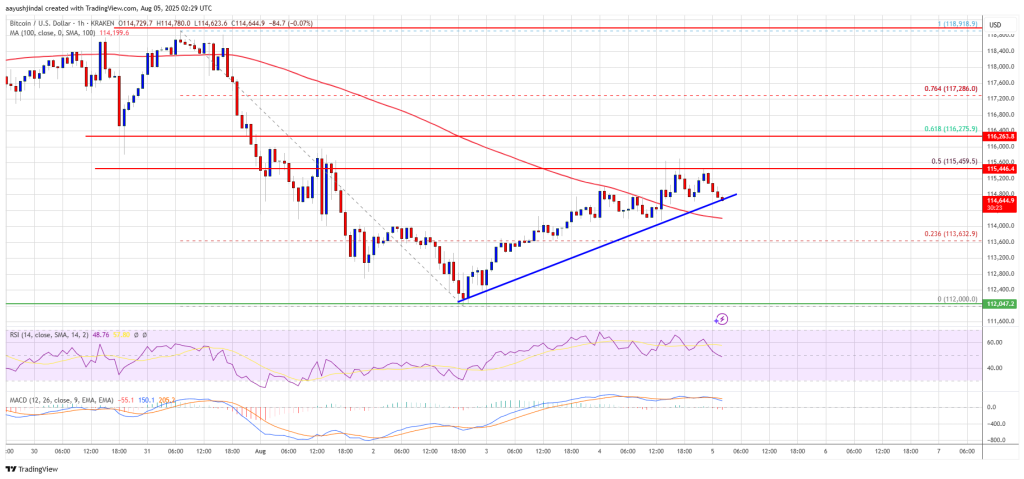
Immediate resistance on the upside is NEAR the $115,500 level. It is close to the 50% Fib retracement level of the downward move from the $118,918 swing high to the $112,000 low. The first key resistance is near the $116,250 level. The next resistance could be $116,800. A close above the $116,800 resistance might send the price further higher. In the stated case, the price could rise and test the $118,500 resistance level. Any more gains might send the price toward the $120,500 level. The main target could be $121,200.
Another Decline In BTC?
If Bitcoin fails to rise above the $115,500 resistance zone, it could start another decline. Immediate support is near the $114,600 level. The first major support is near the $113,500 level.
The next support is now near the $112,000 zone. Any more losses might send the price toward the $110,500 support in the near term. The main support sits at $108,500, below which BTC might continue to move down.
Technical indicators:
Hourly MACD – The MACD is now gaining pace in the bullish zone.
Hourly RSI (Relative Strength Index) – The RSI for BTC/USD is now above the 50 level.
Major Support Levels – $114,600, followed by $113,500.
Major Resistance Levels – $115,500 and $116,800.
