Bitcoin Bulls Bailing? Aggressive Selling Signals Mature Cycle as Risk Appetite Cools

Is the Bitcoin bull run running out of steam? Long-term holders are dumping coins at the fastest pace since 2021—just as prices flirt with all-time highs.
Warning signs flash as whale wallets empty
On-chain data shows a surge in 'old coin' movement—typically a precursor to market tops. Meanwhile, retail FOMO buyers keep stacking SATs like there's no tomorrow (there might not be).
The great crypto contradiction
Institutions keep preaching 'digital gold' while traders treat it like a meme stock. Someone's wrong—and with leverage ratios hitting record highs, the reckoning could get messy.
Bonus jab: Nothing says 'mature asset class' like 20% daily swings based on Elon Musk tweets and Fed whispers.
Bitcoin Harmonic Mean of NUPL and MVRV Signals Cycle Maturity
According to Adler, the Bitcoin Harmonic Mean of NUPL (Net Unrealized Profit/Loss) and MVRV (Market Value to Realized Value) reveals a clear shift in investor behavior as the bull cycle matures. Adler’s data shows that in March and December 2024, this combined metric peaked above 1.9, marking periods of strong market conviction where investors continued holding despite elevated profit margins.
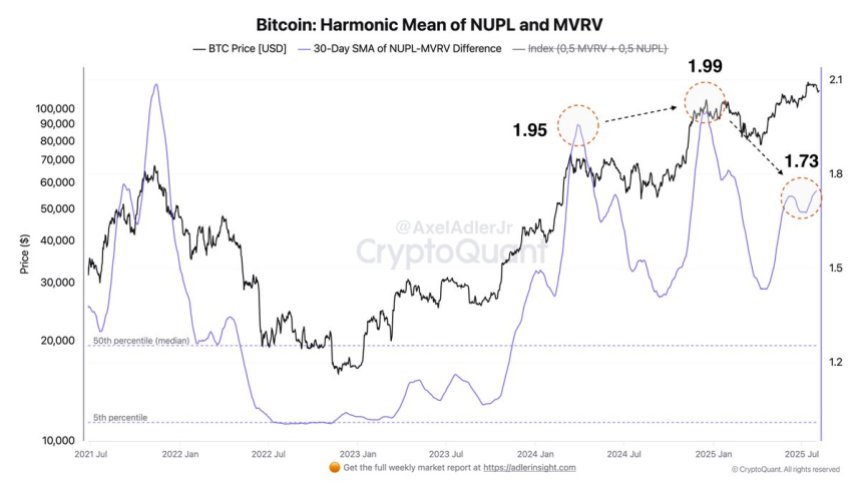
However, the current readings show a noticeable decline, with the harmonic mean forming a lower peak, signaling that holders are becoming more inclined to realize profits rather than hold through new price surges. Adler points out that each rally now brings a smaller marginal premium to holders’ cost basis, which translates into increasing selling pressure as the market struggles to sustain higher valuations.
This does not mean the bull market is over, but it does indicate that investor risk appetite is diminishing. Profit-taking activity is gradually outweighing the influx of new demand, which could cap future rallies.
Nevertheless, Adler expects two more significant rallies in this cycle, driven by macro catalysts such as the anticipated two Federal Reserve rate cuts later this year. These events could reignite market momentum and push bitcoin to new highs. However, Adler warns that after these final pushes, selling pressure from long-term holders may outweigh fresh demand, leading the market into a broader correction phase.
Price Analysis: Testing Resistance After Breakdown
Bitcoin (BTC) is currently trading at $114,690, attempting to recover after a sharp breakdown below the $115,724 support, now acting as resistance. The daily chart shows BTC forming a modest rebound after reaching a local low of $112,200, with price action consolidating around the 50-day Simple Moving Average (SMA) at $112,218. This moving average provided strong support during the recent correction, preventing a deeper decline towards the $110K zone.
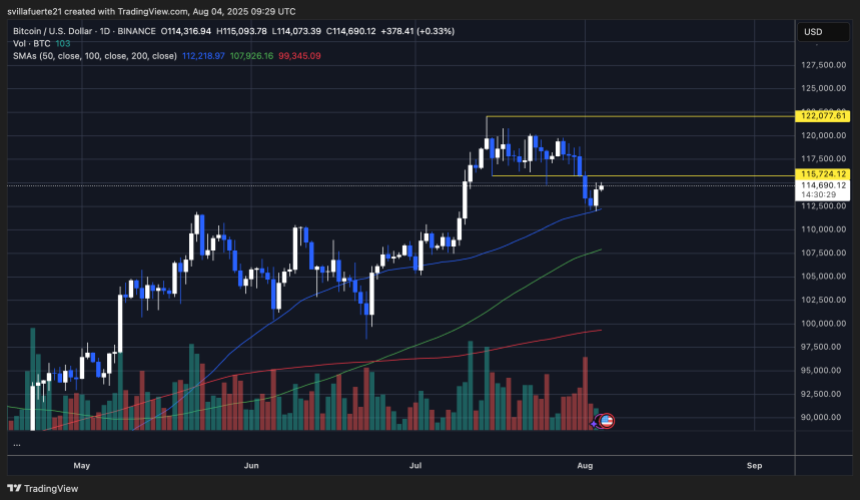
The next critical level to watch is the $115,724 resistance. A daily close above this level WOULD signal a potential reclaim of the previous range, increasing the probability of a retest of the $122,077 local high. However, if BTC fails to break this level convincingly, it could indicate that bears are still in control, leading to a possible retest of the 50-day SMA support.
Volume remains subdued compared to previous rallies, suggesting a lack of strong buying momentum. The 100-day SMA at $107,926 and the 200-day SMA at $99,345 remain key dynamic support levels should further downside pressure emerge.
Featured image from Dall-E, chart from TradingView

Log in to Reply
Log in to comment your thoughtsComments
Related Articles
|Square
Get the BTCC app to start your crypto journey
Get started today Scan to join our 100M+ users