Altcoin Season Arrives: 6 Explosive Metrics Signaling a Crypto Market Revolution

Bitcoin’s boring. Ethereum’s old news. The real action? Altcoins are mooning—and these six metrics prove it.
Dominance Drops as Alts Surge
BTC’s market share is bleeding out—altcoins now account for over 40% of total crypto capitalization. The herd’s finally rotating.
Volume Spikes Where It Matters
Binance and Coinbase alt pairs saw 300%+ volume jumps last week. Retail’s back—and they’re not buying blue chips this time.
Social Media Goes Alt-Crazy
Twitter mentions for mid-cap alts tripled since June. Even Instagram finfluencers are dumping their ‘safe’ ETF pitches for shitcoin alpha.
VCs Quietly Accumulating
Seed rounds for obscure L1s doubled QoQ. Smart money knows the cycle—pump comes after the stealth accumulation phase.
Derivatives Heat Up
Altcoin futures open interest just hit $12B. Leveraged longs are piling in—funding rates suggest this isn’t just hedging.
On-Chain Metrics Scream FOMO
Active addresses for top 50 alts hit ATHs. Network congestion? A ‘problem’ only bulls complain about.
Regulators will hate this. Banks will dismiss it. But the charts don’t lie—we’re early in the altseason playbook. Just don’t tell the ‘diversified portfolio’ guys at Goldman.
These Altcoin Metrics Are Observing Positive Developments
In a new thread on X, CryptoQuant has discussed about how the altcoins have been heating up since Bitcoin’s breakout to the new all-time high (ATH) in mid-July.
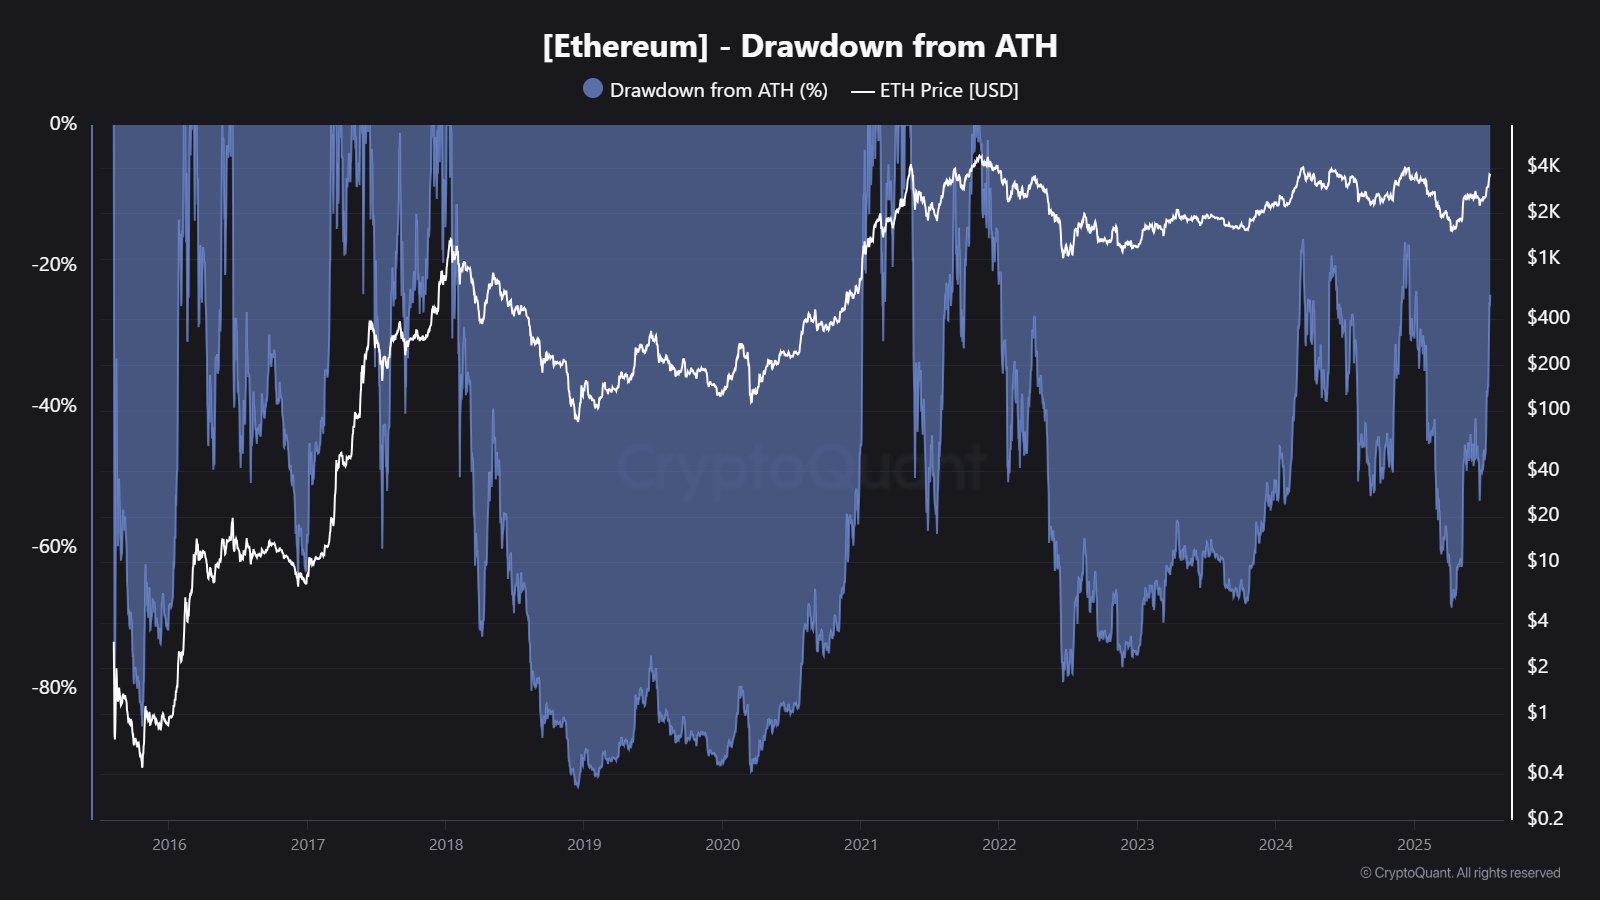
At the forefront of this alt push has been Ethereum, the cryptocurrency second only to Bitcoin in terms of market cap. Since BTC’s high, ETH has broken out above the $3,000 level and has neared $4,000. The coin is still a distance away from its ATH of $4,800, but it’s getting closer.
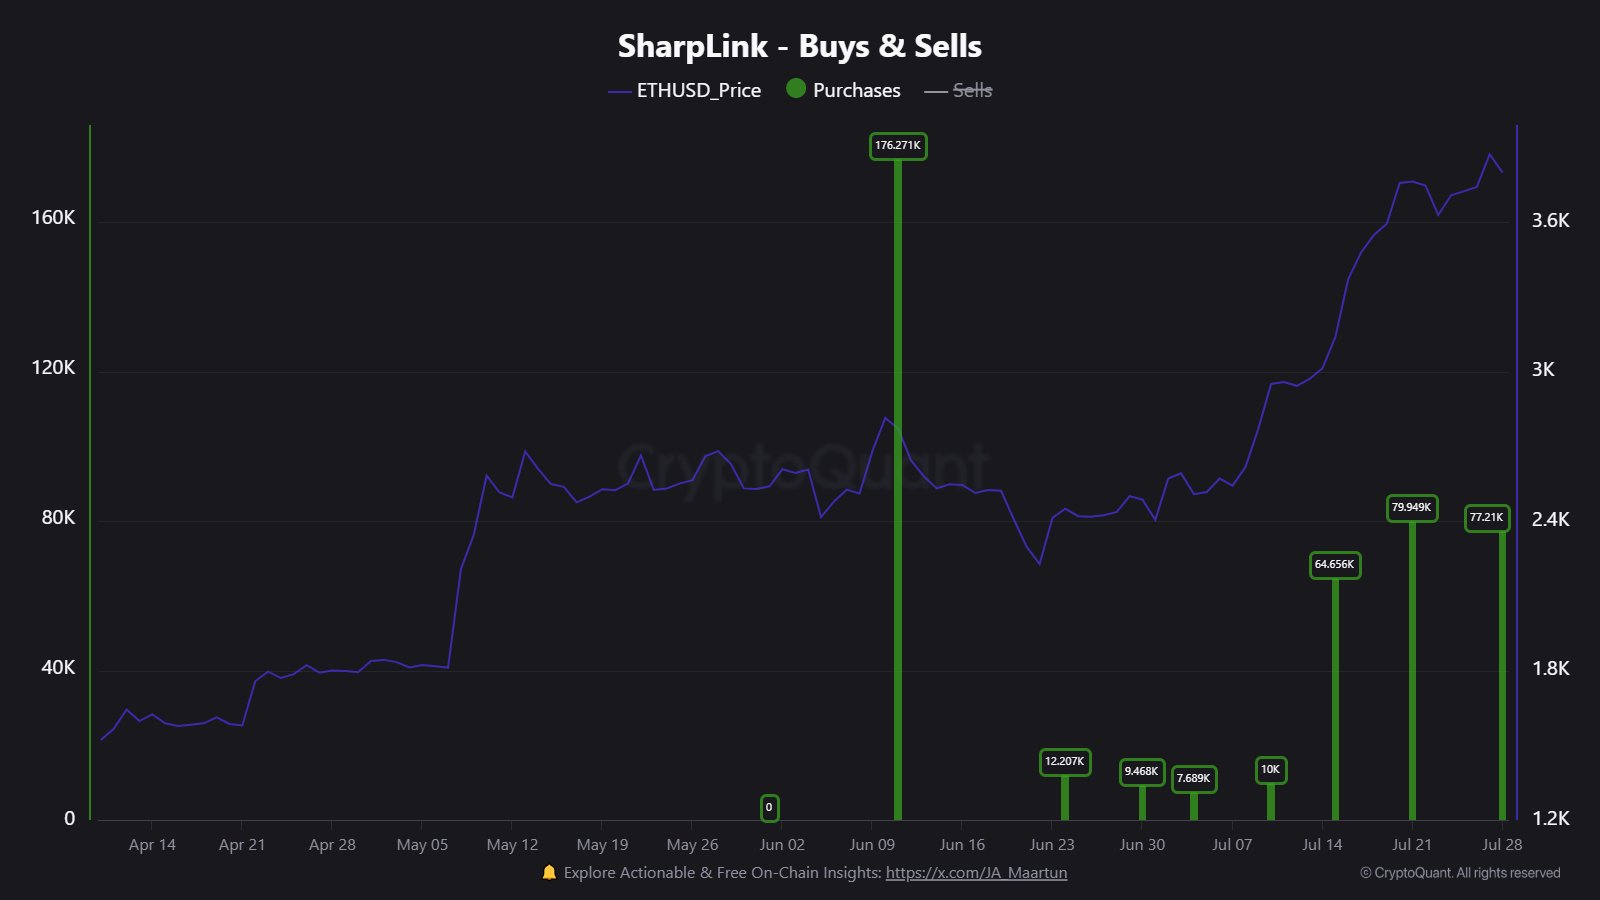
The HYPE around the cryptocurrency has been accompanied by major buys from Sharplink, the Strategy equivalent of ETH. the firm currently owns around 438,190 tokens of the asset.
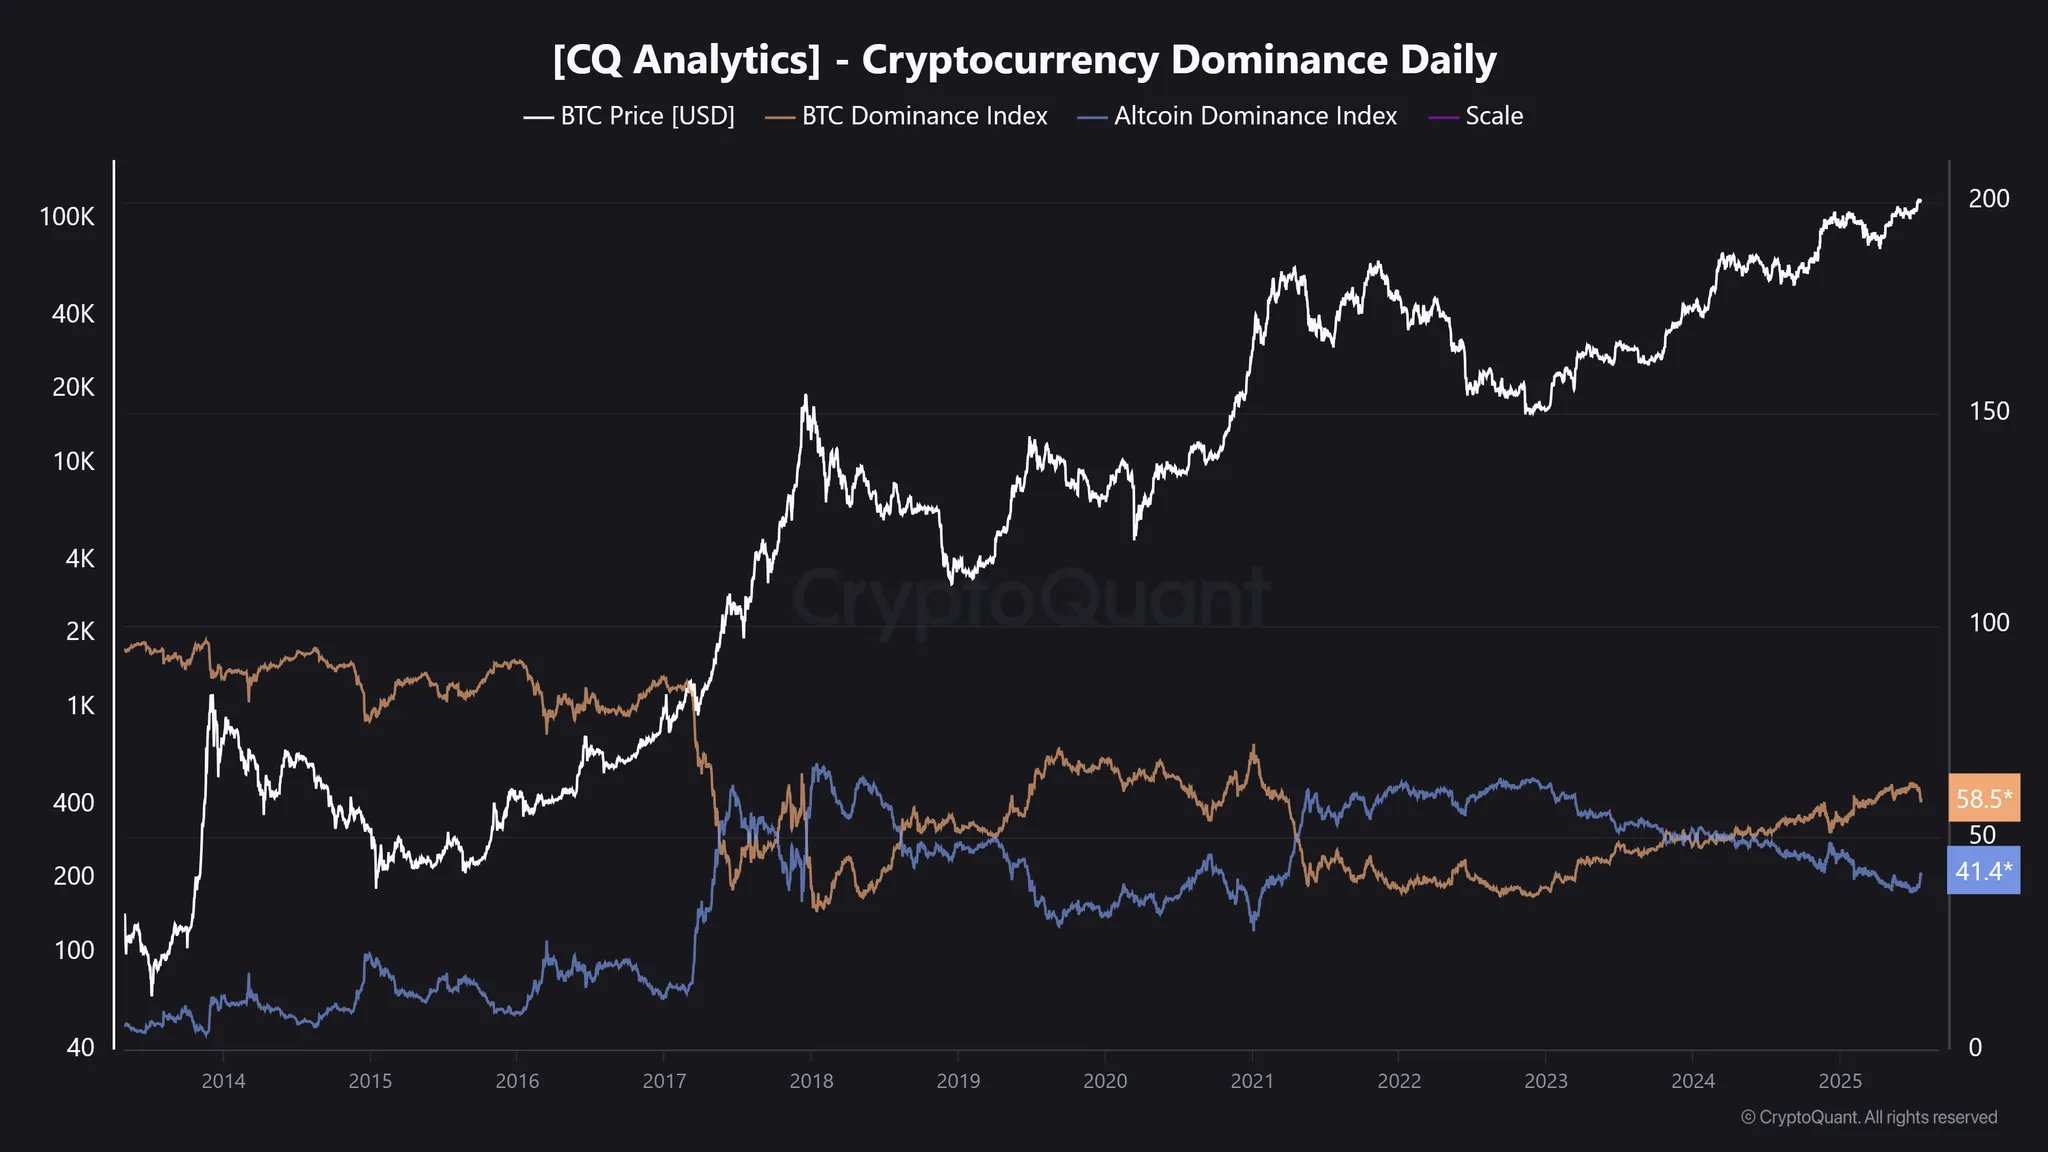
Since the altcoin rally has begun, BTC has only shown sideways action. A natural consequence of this has been that the number one digital asset has lost market dominance.
As is usually the case, the bullish momentum in the market has brought in speculative interest from the investors. From the below chart, it’s apparent that the futures volume associated with ethereum and the altcoins has seen a strong surge.
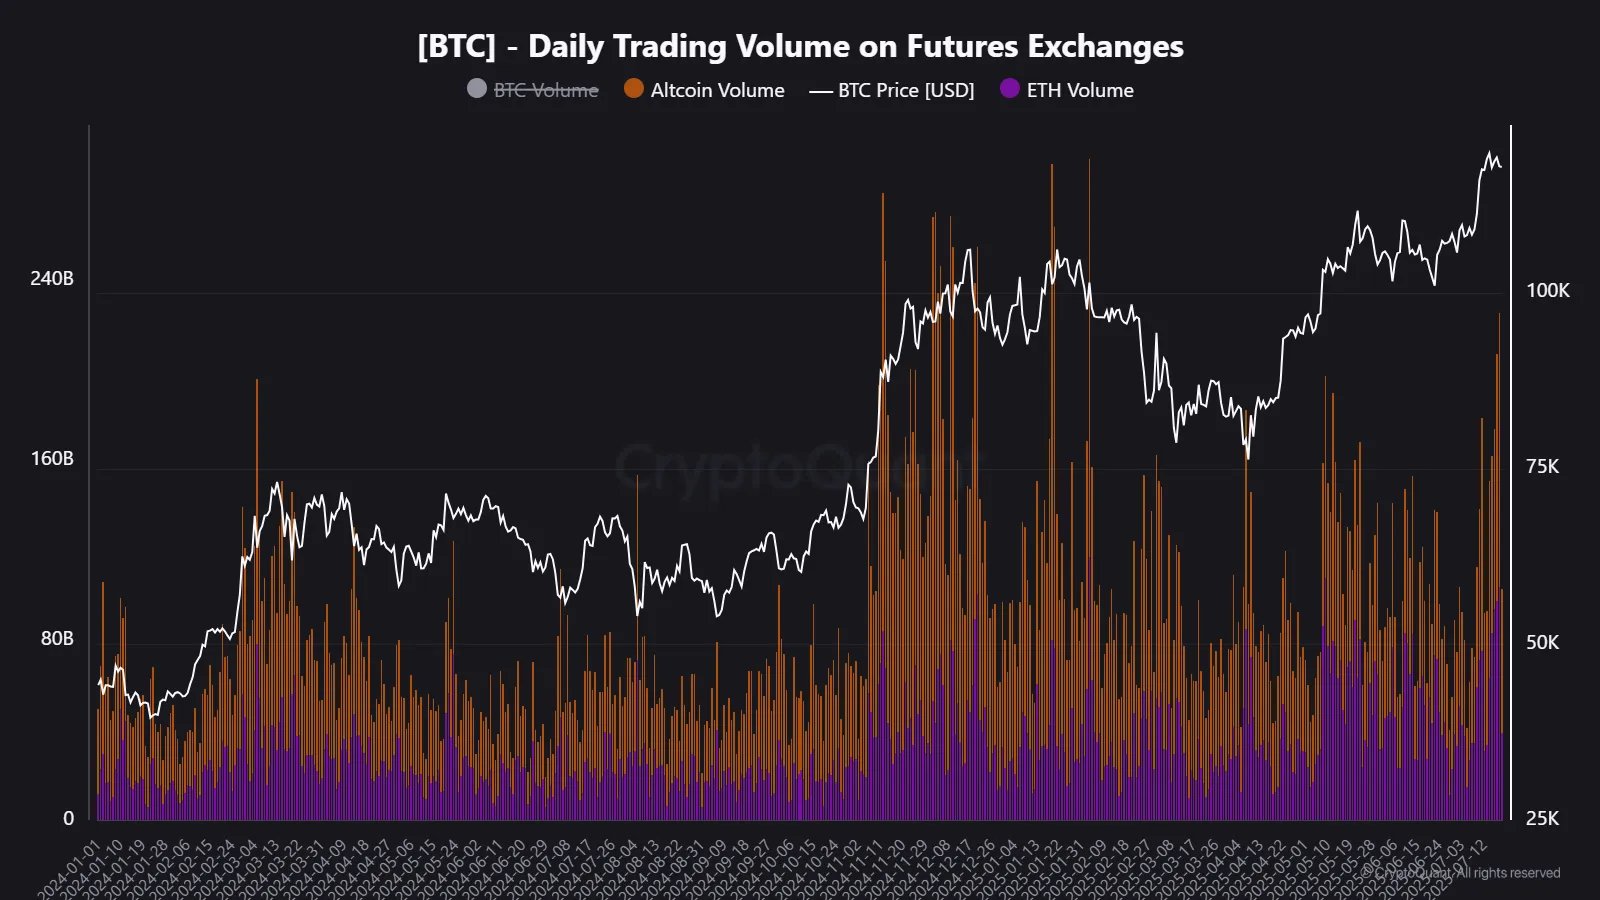
The combined futures trading volume of the altcoin sector has recently hit the $223.6 billion mark, which is the highest level in five months. While attention has poured into the alts, it has shifted away from BTC.
“Altcoins and ETH now make up 83% of total futures volume, with Bitcoin accounting for just 17%,” notes the analytics firm. Earlier in the year, BTC was sitting at a peak futures volume dominance of more than 50%. Most of the 424 futures pairs on cryptocurrency exchange Binance have seen a positive percentage change since BTC’s ATH.
The final metric shared by CryptoQuant is the Bitcoin Retail Investor Demand. It measures, as its name suggests, the amount of demand for the asset that exists among the retail cohort.
Since these holders tend to have relatively small holdings, the indicator uses the transaction volume associated with transfers valued at less than $10,000 as a proxy for the activity among them.
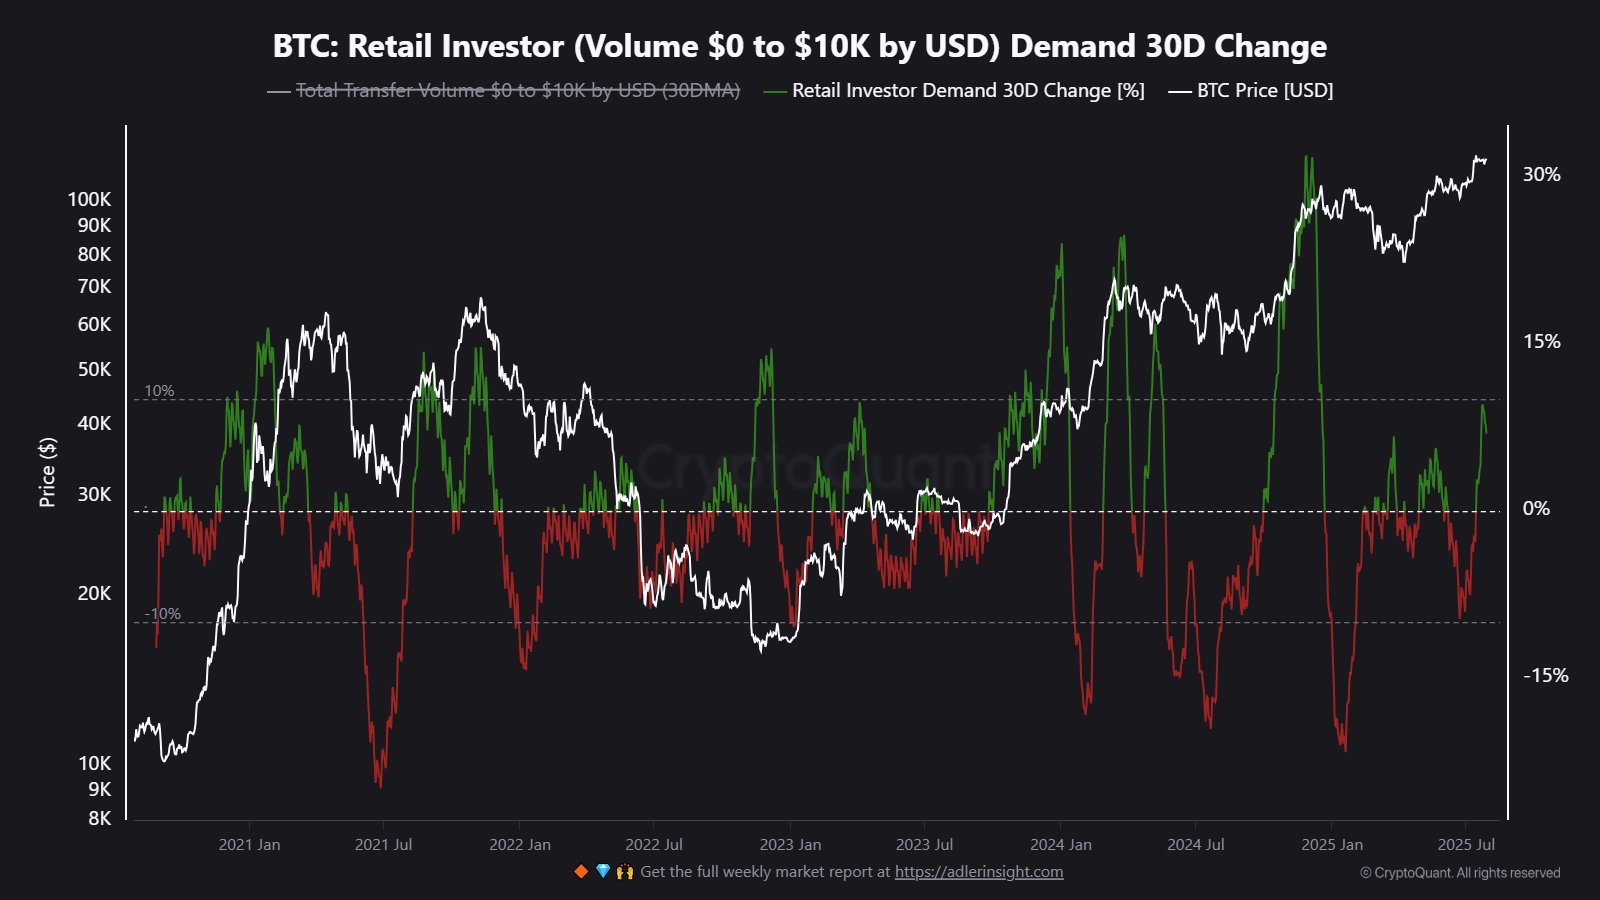
As displayed in the above graph, the 30-day change of the bitcoin Retail Investor Demand has turned positive recently, which suggests small hands are showing interest in the market. The analytics firm describes the trend as a “signal we’ve seen before major rallies on both Bitcoin and Altcoins.”
ETH Price
At the time of writing, Ethereum is floating around $3,770, up around 2% over the last 24 hours.
