Bitcoin’s Wild Ride: Chart Pattern Warns of Potential Plunge to $109,000

Bitcoin bulls, brace yourselves—the king of crypto might be gearing up for a stomach-churning drop.
Technical patterns suggest a possible nosedive to $109,000, proving once again that crypto markets laugh at 'stable' and 'predictable.' Just when Wall Street thought they had it figured out.
Will this be another buy-the-dip opportunity or the start of a deeper correction? One thing's certain: hodlers' palms are getting sweaty.
Remember folks: in crypto, even the 'safe' bets come with a free rollercoaster ride—no amusement park ticket required.
How BTC Price Could Be At Risk Of Extended Decline
In a July 25 post on social media platform X, Chartered Market Technician (CMT) Aksel Kibar painted a bearish picture for the Bitcoin price after falling to $115,000 on Friday. According to the analyst, the flagship cryptocurrency could be on its way to around $109,000 in the coming days.
Kibar’s bearish stance revolves around the inverse head-and-shoulder pattern on the Bitcoin price chart on the weekly timeframe. The inverse head-and-shoulders pattern is a technical analysis formation characterized by three distinct price troughs, including a lower “head” set between two higher “shoulders.”
Typically, the inverse pattern signals a possible bullish breakout and is validated when the price breaches the neckline — a trendline connecting the crests (swing highs) between the head. As shown in the chart below, the bitcoin price has already broken through the neckline to reach a new all-time high.
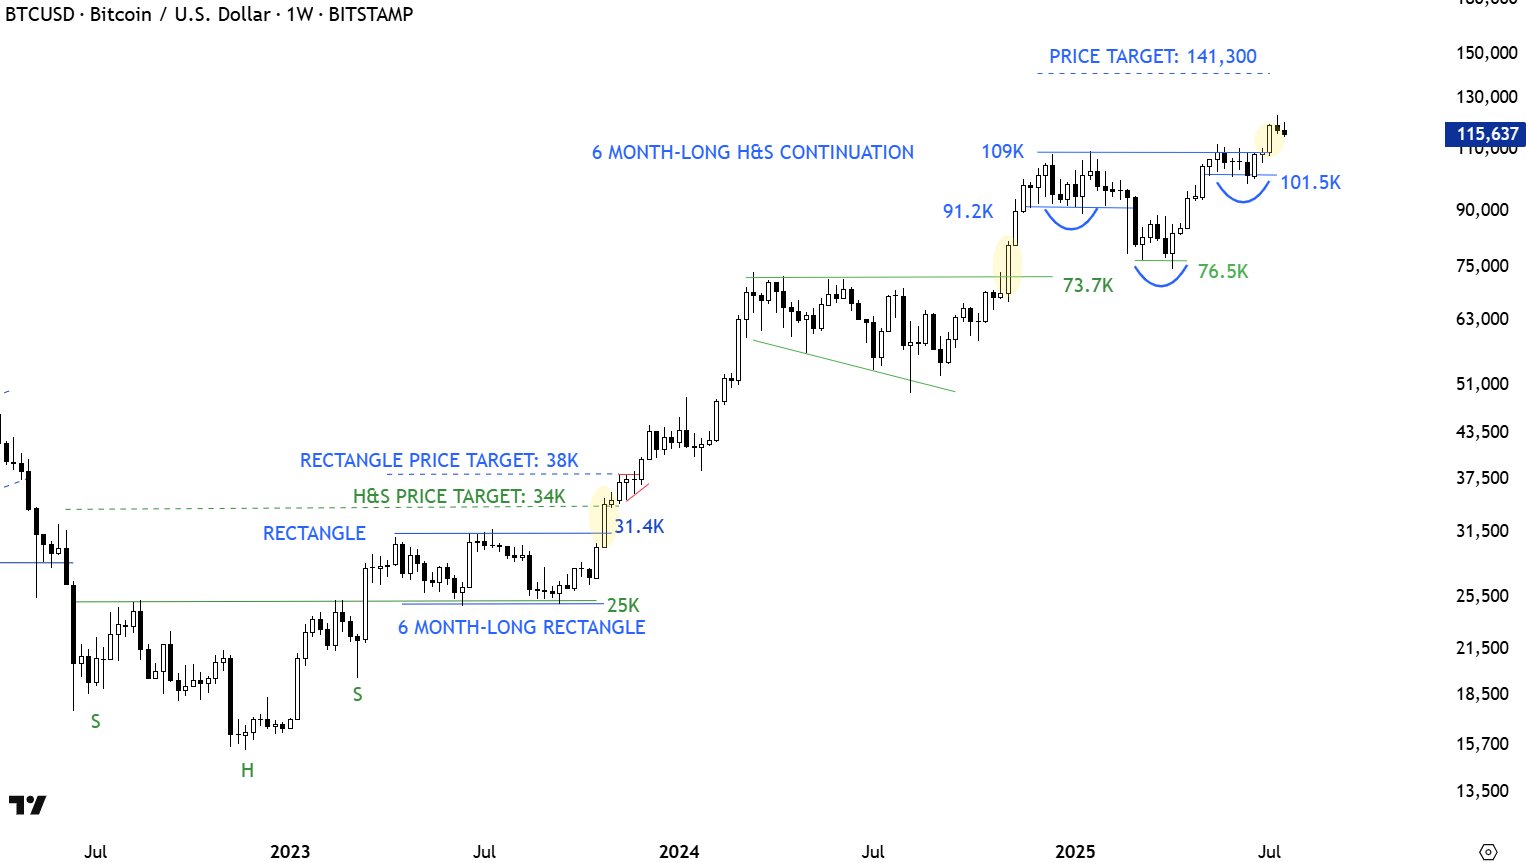
However, Kibar explained that the price breakout witnessed by Bitcoin might not be the textbook breakout typically expected in most inverse head-and-shoulders pattern scenarios. According to the market expert, most head-and-shoulder breakouts are followed by pullbacks and retests rather than straight rallies.
Chart data provided by the analyst shows that, since May 2017, the Bitcoin price has witnessed a retest or pullback (type 2 continuation) more times than a straight rally (type 1 continuation) after a head-and-shoulder pattern breakout. This trend explains the rationale behind Kibar’s bearish projection for BTC in the next few days.
If the price of Bitcoin does suffer a deeper correction as in the type 2 continuation, it is likely to return to the neckline — and around the $109,000 mark. A move like this WOULD represent an over 5% decline from the current price point.
Bitcoin Price At A Glance
After a horrendous start to the day, the market leader seems to be recovering nicely from its recent fall to $115,000. As of this writing, the price of BTC stands at around $117,323, reflecting a mere 0.6% decline in the past 24 hours.
