Bitcoin’s Flow Pulse Shatters 2017 & 2021 Patterns – Is This Rally Built to Last?

Bitcoin’s price action just ripped up the historical playbook—and traders are scrambling to adjust.
No more lazy comparisons to 2017 or 2021. This cycle’s on-chain flow dynamics look nothing like prior bull runs. Liquidity moves faster, whales accumulate quieter, and retail FOMO hasn’t even peaked yet.
Key divergence? The money’s coming from places Wall Street didn’t bother mapping. Private wallets swallowing supply while ETF paper plays catch-up. Classic finance always shows up late with a checkbook and bad timing.
One thing’s clear: when the old patterns break, new rules get written. Whether that means higher highs or harder crashes depends who’s holding the bags this time.
Bitcoin Flow Pulse Shows Low Exchange Activity
According to a CryptoQuant Quicktake post by contributor Arab Chain, the bitcoin Inter-Exchange Flow Pulse (IFP) indicator is exhibiting “interesting behavior” in mid-2025. Notably, large investors do not appear to be selling their holdings, despite BTC trading at record highs.
Typically, sophisticated investors begin profit-taking as an asset approaches ATH territory. However, that behavior appears to be largely absent this time.
The lack of selling activity stands in contrast to the market peaks of 2017 and 2021. During both these instances, there were large BTC inflows to exchanges, which were closely followed by significant price corrections.
Arab Chain shared the following chart highlighting the relationship between a rising IFP and Bitcoin’s price trajectory. The chart illustrates how price corrections followed rising IFP levels at the end of 2017 and again in 2021. In 2025, despite an IFP surge earlier in the year, the BTC market has since consolidated rather than corrected.
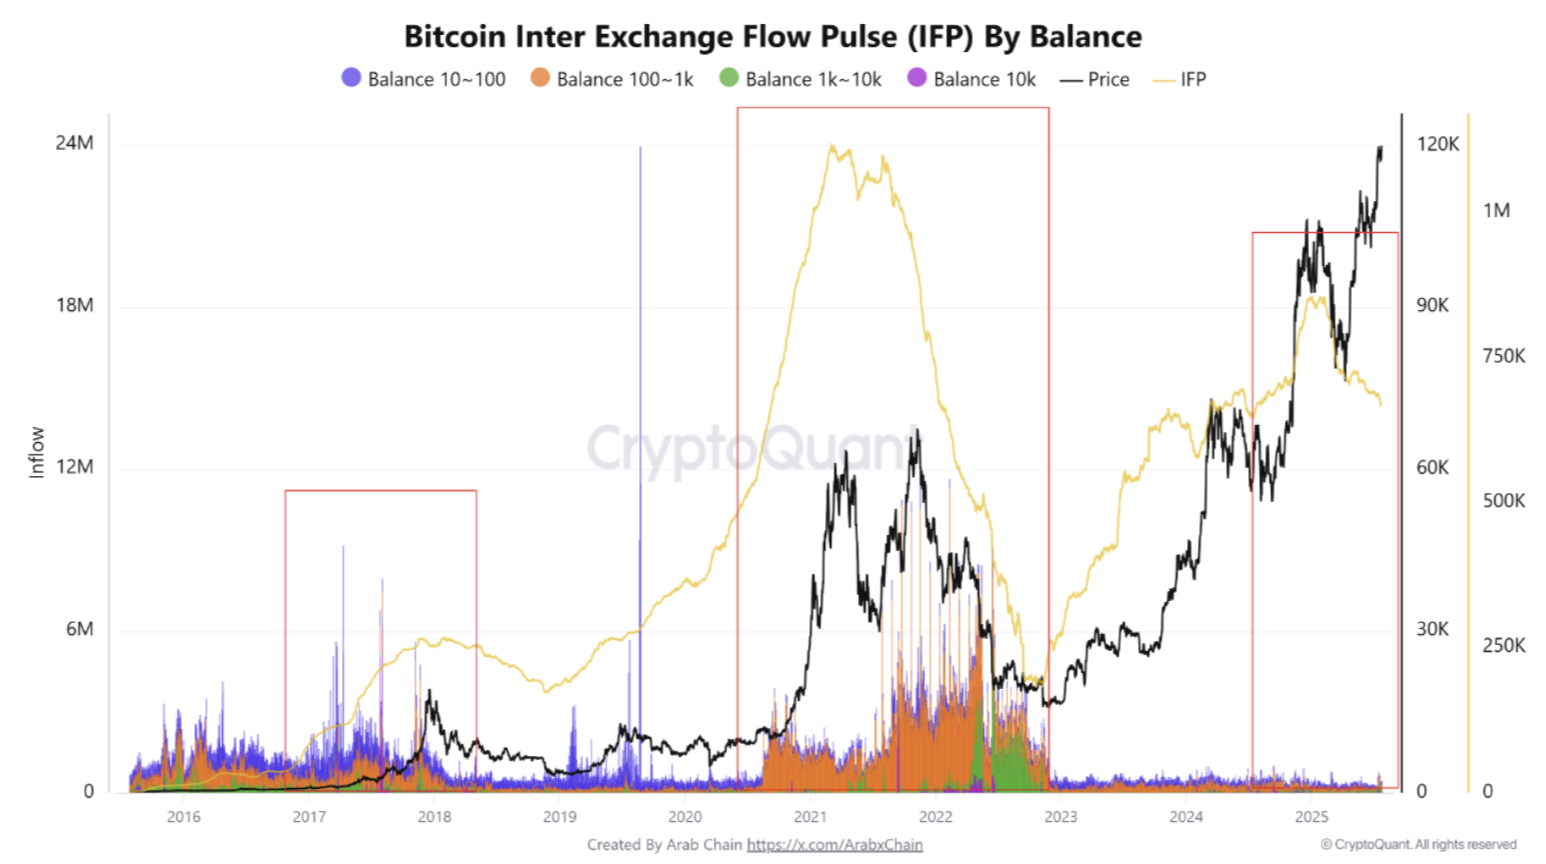
For context, the IFP indicator tracks the volume of Bitcoin transferred between centralized exchanges, providing insights into investor sentiment and market conditions. A rising IFP typically suggests growing intent to sell or arbitrage, while a declining IFP indicates reduced exchange activity and stronger holder conviction.
This year’s dynamic between IFP and BTC price suggests investors are choosing to hold Bitcoin, even as prices hover near record highs. Arab Chain noted that such behavior reinforces the bullish case. They said:
This behavior indicates high confidence in the uptrend so far and partly explains why the price has continued to rise without any clear selling pressure. On the other hand, if the Bitcoin IFP indicator begins to rise, it indicates an intention to sell and an anticipated significant supply pressure. Therefore, a sudden rise in the indicator is a strong warning sign for speculators.
BTC Miners Engaging In Profit-Taking
While large investors remain largely inactive on the selling front, Bitcoin miners appear to be cashing in on the current rally. Miner outflows surged to 16,000 BTC on July 15 – the highest single-day level since April 7.
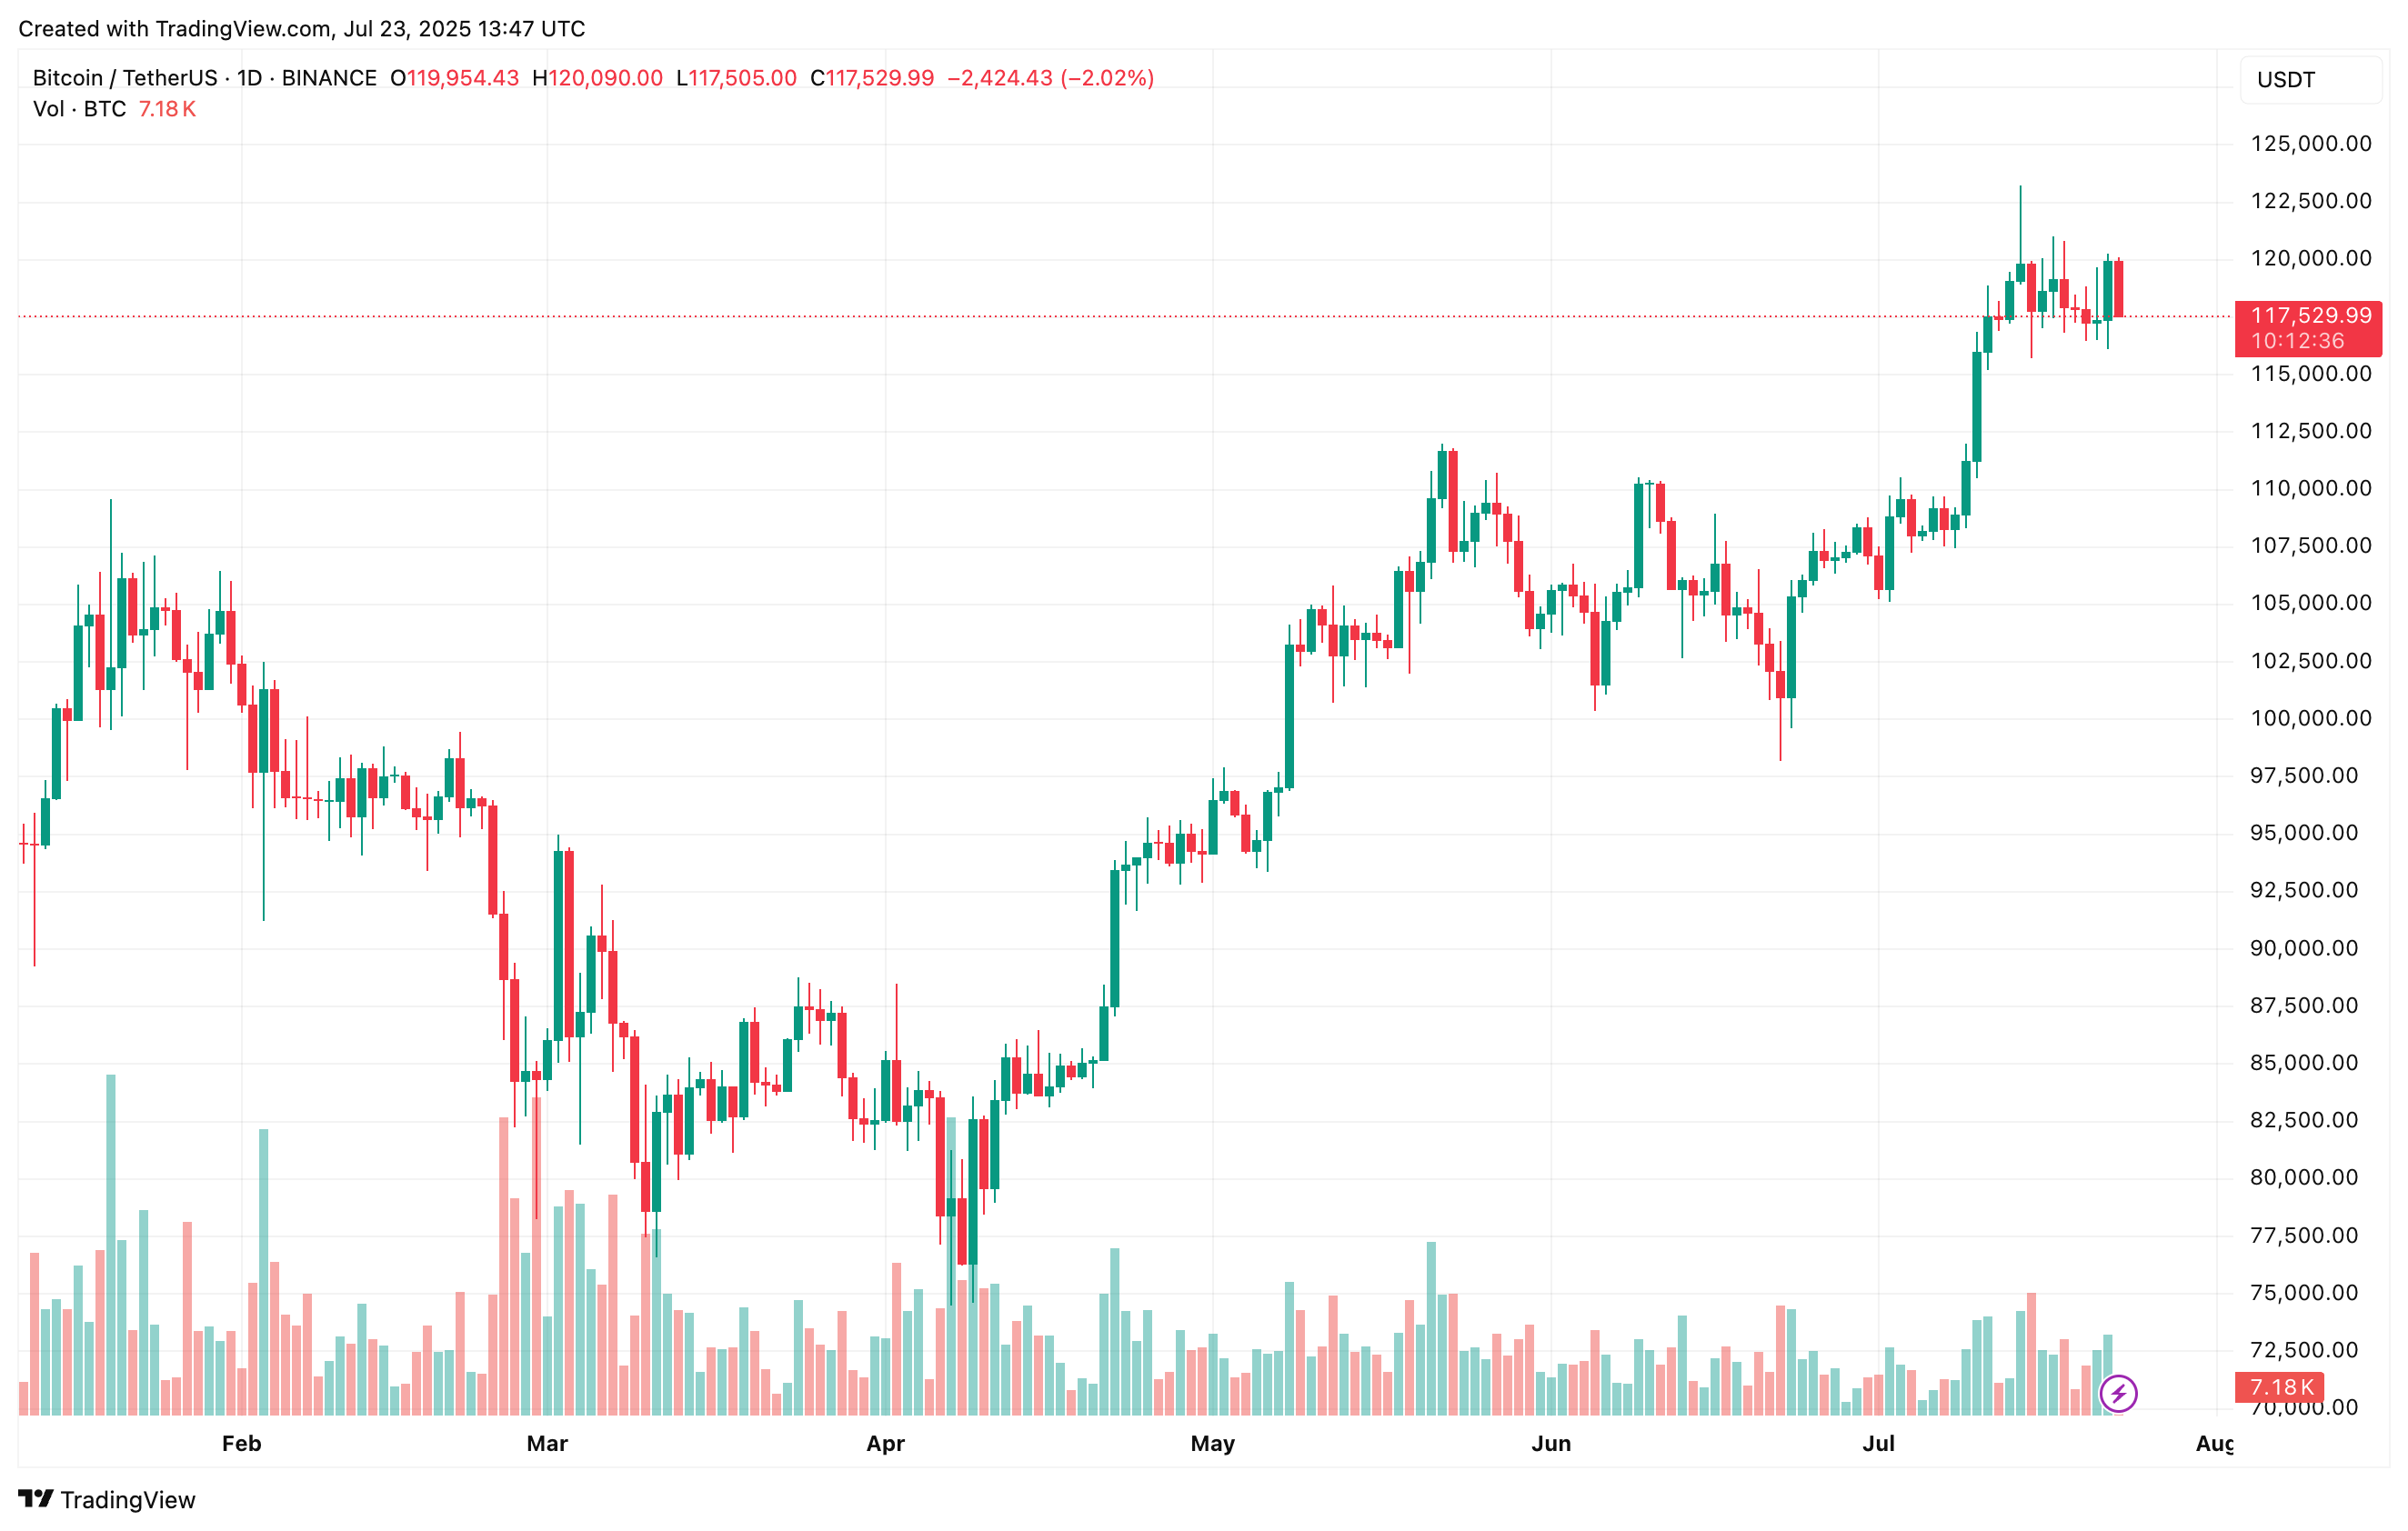
As selling pressure builds, recent analysis by CryptoQuant contributor Chairman Lee highlights a key support level that BTC must defend to remain on track for the $180,000 year-end target. At press time, BTC trades at $117,529, down 1.4% in the past 24 hours.